CVEN3501 – WATER RESOURCES ENGINEERING
CVEN3501 Water Resources Engineering Assignment 1- HYDROLOGY
CVEN3501 – WATER RESOURCES ENGINEERING
ASSIGNMENT 1 (Hydrology) – 50 Marks – 25% of course
Please submit your assignment via Moodle.
Complete the student declaration form on Moodle. Until this is marked complete you will not be able to access the submission links.
Ensure that you show your working and/or summaries of the data that you have used for the calculations. You cannot upload any supporting spreadsheets. Only your report will be marked. State any assumptions that are required.
Penalty for late submission is 10% per day.
PART A: Evaporation and Climate Change (25 marks)
QA1. Penman-Monteith Evapotranspiration (15 marks)
Calculate the daily evapotranspiration using the Penman-Monteith method for Sydney. The United Nations Food and Agriculture Organisation (FAO) has guidelines on the calculations which may be useful and the information in lectures and study kit may also be used. You should do all calculations from scratch (e.g. top of atmosphere radiation) and not use the tables in the FAO Annexes.
http://www.fao.org/docrep/x0490e/x0490e08.htm#calculation%20procedure
Do the calculations for the day of your birth. For example, if you were born on January 12th, 1993 you would use the data for January 12th, 2019. If you were born on June 17th, 1993, you would use June 17th, 2019.
Input meteorological data should be obtained from http://www.bom.gov.au/climate/data/ for Sydney (station number 066062) – pick the Data about: Weather & Climate in Step 1 of the webpage.
You will need to collect the following data. There will be marks for each calculation as well as the final evapotranspiration estimate. Answers should be provided to 4 significant figures.
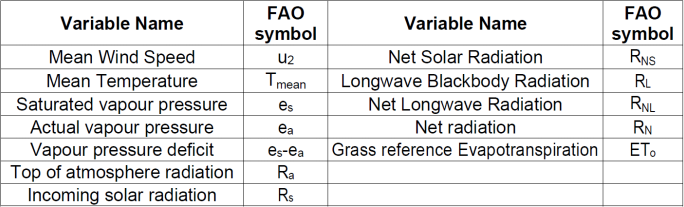
Common station data for Sydney is provided below and should be used in your calculations where necessary.
• Altitude = 6 m
• Latitude = -33.83 °S
• Psychometric constant (γ) = 0.067 kPa °C-1
• Wind speed height measurements = 2 m
QA2. Evaporation and evapotranspiration comparisons (10 marks)
In QA1 you calculated the reference crop evapotranspiration for Sydney for one day of the year. This question requires you to compare that calculation to other methods of calculating evaporation and evapotranspiration and discuss the differences that you find.
a) Pan evaporation measurement comparison (3 marks)
Pan evaporation measurements are made at 9am each morning and therefore mainly reflect the evaporation that has occurred on the day prior to the measurement. For example, the pan evaporation is 9.8 mm on March 6th, 2017. The majority of this evaporation will have occurred on the 5th March (after 9am).
Therefore, for the day after you did your calculations in Question 1, find the measurement of pan evaporation for Sydney (Stn 066062).
Comment on the differences between this measurement and the Penman Monteith calculation. Think about the sources of error in measurements and the assumptions of the Penman Monteith equation and the Class A evaporation pan.
b) Picking evaporation values for design (7 marks)
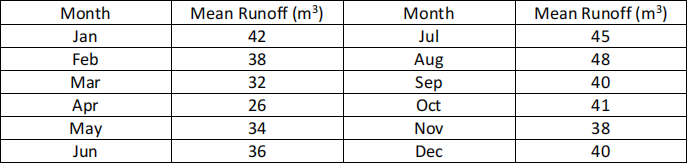
A mine needs to build an evaporation pond to ensure that runoff from the mine site does not enter the surrounding environment i.e. all the runoff from the site is to be evaporated. The volume of runoff entering the pond each month is listed in the table below. The mine is located near Orange in NSW.
Your task is to design the pond by determining the required surface area and depth so there is no runoff from the pond in any month of the year and that by the end of the year all the runoff from the site has been evaporated. Runoff can be stored for more than one month if necessary although the pond must be empty at the end of the year. You should model each month of the year to prove that there are no overflows and that at the end of the year the pond is empty. The pond should have as small a surface area as possible whilst meeting the above criteria. The maximum depth is limited to 300 mm, but the pond should be shallower if possible.
Assume that the runoff enters the pond at the start of each month. It is up to you to obtain appropriate evaporation rates to be used for design; this may be either observed or modelled estimates of evaporation. You can assume that the base of the pond is completely sealed so there are no infiltration losses into the ground.
Show your working and the data you have used to justify your answer. Your answer should include appropriate plots to illustrate your results. Discuss the uncertainties that are likely in your answer. There are many possible correct answers to this problem – the important point is to make reasonable assumptions, justify your answer and show how you have minimized the pond surface area whilst meeting the constraints.
PART B: Design Flow Estimation (25 marks)
You have been asked to determine design flows for a project located in Lansdowne, NSW.
The study location and catchment boundary are shown in Figure 1.
• Outlet Longitude: 152.514 °E
• Outlet Latitude: -31.787 °S
• Centroid Longitude: 152.462 °E
• Centroid Latitude: -31.705 °S
• Catchment area = 96 km2
The flows from the gauge on the Lansdowne River @ Lansdowne (Gauge Number 208015) are to be considered. Hourly streamflow data in ML/Day is available at this location. More information about the gauged data (including rating curves) is available on Moodle or on the Office of Water Real Time Data website (http://realtimedata.water.nsw.gov.au/water.stm)
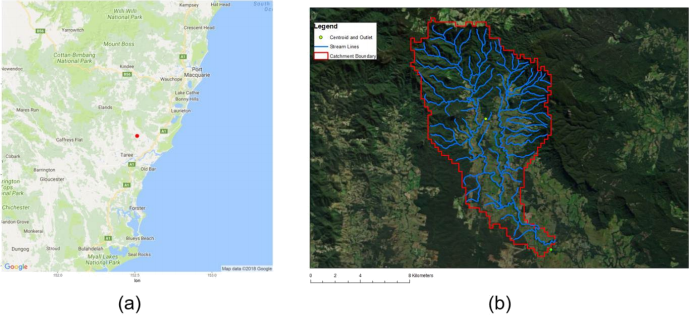
Figure 1: (a) Location of Lansdowne and (b) Lansdowne River @ Lansdowne Catchment
QB1. Flood frequency analysis using FLIKE (10 marks)
a) Using the recorded flow data at the Lansdowne River Gauge (spreadsheet on Moodle and location shown on Figure 1 (b), undertake a Flood Frequency Analysis (based on the Annual Maximum Series) using FLIKE to determine the peak flow in the 2% AEP flood event in m3/s. You will need to decide what probability distribution to use as well as picking the fitting method. You should justify your choices (7 marks)
b) Comment on the uncertainty in your answer and the possible reasons for this (3 marks)
QB2. Regional Flood Frequency Estimation (RFFE) method (15 marks)
a) The Regional Flood Frequency Estimation (RFFE) method is to be used to check the results from QB1. Calculate the flow at the Lansdowne gauge (5 marks)
b) Comment on the differences between this answer and your answer from QB1 (5 marks)
c) Comment on the sources of uncertainty in the RFFE estimate and how these sources of uncertainty are different from QB1 (5 marks)
2021-03-26