CIS 3100 - Business Intelligence Case
CIS 3100 - Business Intelligence Case
Equal Pay Assessment for Mell Industries, Inc.
1. Project Overview
The activities in this project are designed to provide experience performing data analysis using Microsoft Excel 2016.
You will use assorted functions, calculations, and pivot tables in this project to evaluate employee data and also create an executive summary and visualization.
2. Company Background
Mell Industries is a national manufacturing firm based in Chicago that specializes in textiles. Mell Industries started out as a small factory in Warrenville, Illinois and experienced steady growth over the past twenty-four years. In this time, Mell Industries opened warehouses and factories in the areas surrounding Michigan and Indianapolis, eventually moving their headquarters to Chicago. Mell Industries is at the peak of its growth cycle and seeks to improve its corporate risk management program.
In recent years, Mell Industries has been accused of equal pay discrimination. The accusation originated from a disgruntled employee who leaked sensitive payroll information to the media highlighting the pay disparity between her salary and the salary of a co-worker with the same title, time in grade, and equivalent work history and educational qualifications. Negative public perception can severely impact corporate accomplishments, market share and stock value.
Your specific role in the project
Given the sensitivity of this issue, Mell Industries has hired Cal Poly Pomona to conduct an independent assessment using a sample set of 747 employee records. The company has also offered Cal Poly Pomona bonus compensation for any promising information provided. Mell Industries intends to use these findings to design business controls for ensuring equity in all pay scales and functional roles. These improvements will guide all future employee compensation reviews.
The sample dataset has been given to you as an excel spreadsheet titled Sample_Dataset.xlsx consisting of data with the following 12 column headers.
● Column A - Employee ID
● Column B - Gender
● Column C - Date of Birth
● Column D - Date of Hire
● Column E - Termination Date
● Column F - Occupation
● Column G - Salary
● Column H to L - Employee Evaluation Metrics
Using columns H to L, you will complete a performance rating logic shown in section 7 of this project. The objective of this project is to complete all tasks and determine if allegations into equal pay discrimination have merit.
3. Create Analysis File
Download the Microsoft Excel file named Sample_Dataset.xlsx from Blackboard. This is the initial dataset provided to you by Mell Industries, and contains information about their current employees.
● Create new workbook
Create a new Excel workbook and name it MyAnalysis.xlsx. You will use this workbook to create additional sheets to analyze the data more closely. Your completed worksheet will be the deliverable provided to the client. It will serve as a major artifact to either support or refute the allegations of equal pay discrimination.
● Create new sheets
Rename ‘Sheet1’ as Census. Add two (2) new worksheets by clicking the plus sign next to the Census sheet and name the first sheet as Female_Employees and the second sheet as Male_Employees.

● Data migration into your workbook
Go back to the SampleDataset.xlsx. Select all data by clicking on the top, left-hand side corner of the sheet. This will highlight all the data on that sheet. Copy and paste the data to your MyAnalysis.xlsx, Census sheet. Another way to select all is to click CTRL A, then copy/paste (CNTRL C, and CNTRL V).

● Additional data migration to sheets
On your Census sheet, under the Gender column, filter to ONLY the female employees. Select all the data, then copy and paste it on the Female_Employees sheet. Repeat the same steps for the Male_Employees.
4. Create Pivot Tables
Create the following pivot tables and analyze the count of employees to occupation, and also salaries of males vs. females according to occupation.
● Create an Occupation Pivot table
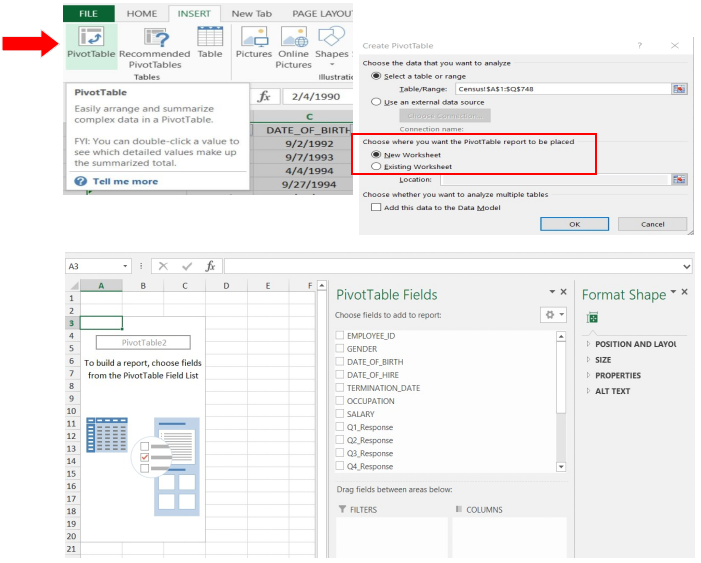
On the Census sheet, highlight the entire sheet (CTRL A). While the dataset is highlighted, from your menu select Insert > Pivot Table. A dialog box will appear. When the dialog box appears, select to place the pivot table in “New worksheet”. Click OK. This will open a new sheet. Rename this to Occupation_pivot.
In the following step, you will select the fields that will be added to this report. For this pivot table, you want to view the number of employees for every job title. To do that, drag ‘OCCUPATION’ from the pivot table fields and drop it under ROWS. Next, drag ‘EMPLOYEE_ID’ and drop it in the ‘VALUES’ section.
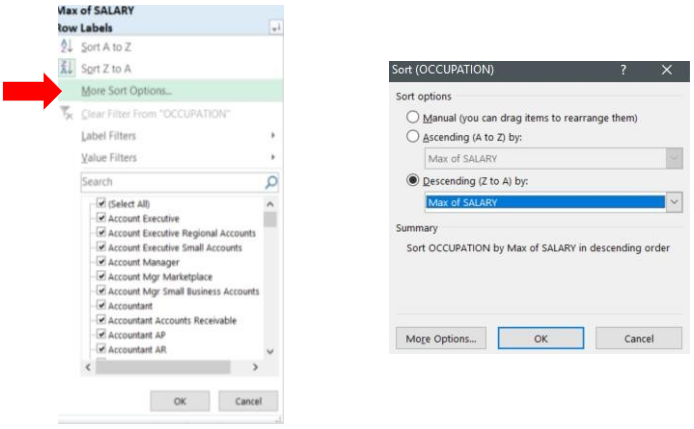
Once the columns have been populated, SORT the data by ‘Count of EMPLOYEE_ID’. Click the drop-down button to the right of the ROW LABEL. Select ‘More sort options’ > Click ‘Descending by’ then on the drop down select ‘Count of EMPLOYEE_ID’. Click OK.
Observe the list of Job titles on the left, and the count of employees to the right. This shows how many employees are working in each type of occupation in descending order. Results should show the top four (4) occupations that are under Average Salary section back in your Data_Analysis table.
4. Create Pivot Tables (continued)
● Create a Salary Pivot table
Now that you know how to create a pivot table, create another one and name it Salary_pivot. This pivot must show the following information:
- Occupation
- Gender, both male, and female (columns)
- Salary
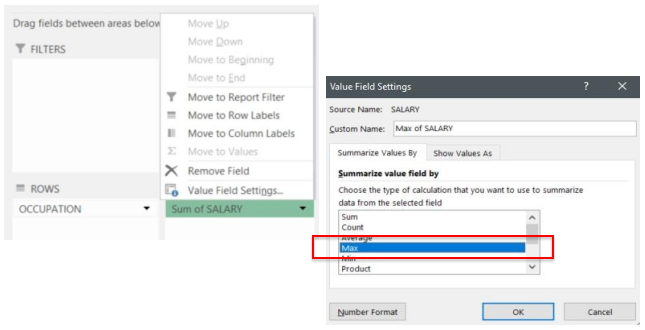
Make sure that the item in ‘VALUES’ is set to ‘MAX of Salary’, then sort the data in descending order. To sort, click the drop-down button next to the ‘Row labels’ title, then select ‘More Sort Option’. Create linked references in section 5 of this project to fill in the Top 10 Highest Paid Positions in your executive summary.
5. Create Executive Summary
Create the layout shown below to summarize salary history analysis from the sample dataset file provided in this project. Be sure to match this formatting as much as possible.
● Data Analysis
Create a new sheet named Data_Analysis. Refer to Figure 1 and replicate this formatting to your Data_Analysis sheet. Once you have accomplished this, populate the blank cells using appropriate functions. Below are helpful hints to support your effort.
To answer the Top 10 Highest Paid Positions section, pivot tables from section 4 of this project are required. Use linked references to populate results for male vs. female.
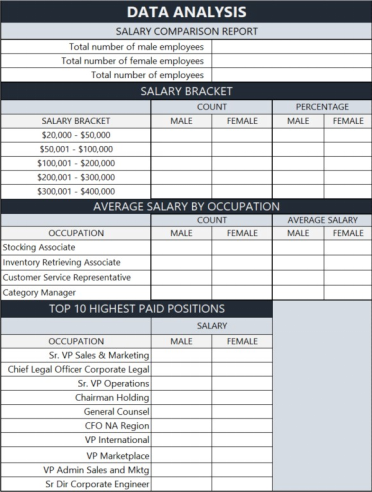
Figure 1 - Data Analysis (Executive Summary)
Important Note: To receive full credit, Excel functions must be used for each required field in the data analysis. This means that no hard-coded numbers should show in the formula bar.
|
Helpful Hints
|
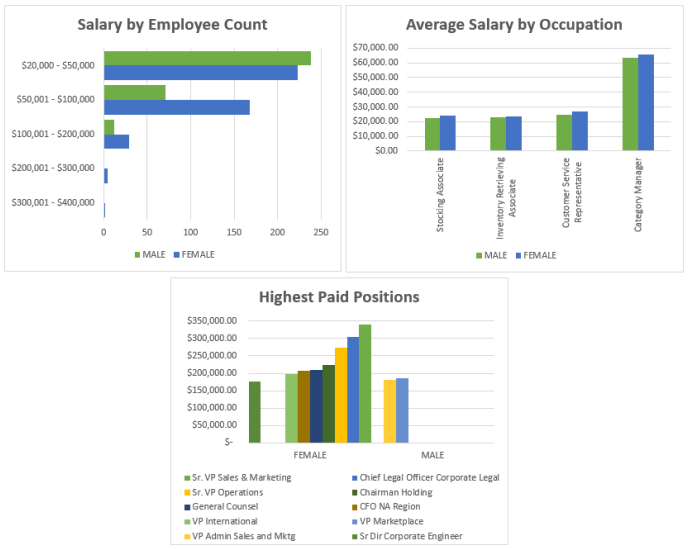
6. Create Visualization
Provide visualization using charts tied to the executive summary created in section 5 of this project.
● Create Charts
On the Data_Analysis sheet, create a chart for the following.
- Salary by Employee Count - Compare COUNT of both male and female employees. Use a Clustered Bar chart
- Average Salary by Occupation - Show the difference in pay between male and female employees based on the specified job positions (Customer Service Representative, Category Manager, Stocking Associate, Inventory Retrieving Associate). Use a Clustered Column chart
- Highest Paid Positions - Use a Clustered Column chart
Note: Make sure to add titles and data labels to your charts.
7. Employee Record Analysis
At this point, you have summarized your analysis of the sample dataset provided by Mell Industries, and should be able to make a preliminary determination as to whether or not the gender pay discrimination allegation has merit.
In order to form a stronger conclusion, you need to correlate your observations with the duration of employee tenure and employee performance evaluation.
● Job Duration
On the Census sheet, insert a new column between ‘Termination Date’ and Occupation’. Title this column ‘Job Duration’. Use a function that will calculate the length of employment for each employee, including anyone no longer with the company. Provide your duration results in X Years, Y Months, Z Days format.
● Employee Evaluation Metrics
Employees are subject to performance evaluation every year, based on five (5) metrics: Knowledge of Work, Communication, Teamwork, Leadership, and Quality of Work. Performance ratings are given by management, but no further evaluation has ever been done on these 5 criteria. Mell Industries would like you to summarize the five metrics to the following criteria.
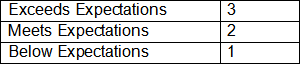
On the Census sheet, insert two (2) new columns to the right of “Quality of Work’. Title the first column ‘Evaluation Score’ and the second column ‘Evaluation Result’. Use a formula to determine the Evaluation Score by rounding the average of all 5 metrics. Then use a nested IF function to apply the appropriate Evaluation Result.
|
Helpful Hints
|
8. Project Deliverables
Upload your completed Microsoft Excel file to Blackboard, according to the specific instructions provided by your instructor.
2021-03-23