ALY2010 Mid Term Project
ALY2010
Mid Term Project
Prof. Dee Chiluiza, PhD
Overview and Rationale
Being able to ask appropriate questions of data is an important part of the work of data analytics. It is also critical to be able to interpret the results of the analysis. This assignment is intended to familiarize you with the data sets and to get you thinking about key business questions you can ask and answer from this data.
This project will help you measure your understandings of basic concepts on analytics.
It will help you measure your skills to obtain basic descriptive statistics from a data set.
It will help you measure your skills to prepare graphical displays of your data analysis results.
It will help you measure your skills on R, R Studio and R Markdown.
It will help you measure your skills to apply critical thinking to make meaningful observations of your data analysis results.
Initial analysis of the data set (Get to know your data)
The data set is located in file: Midterm_dataset.csv, it contains 1,000 observations about Global Sales of a Store Company. The variables names are self-explanatory.
Save the data set inside your ALY2010 R Project/DataSets folder.
Open the data set on Excel to perform an initial overview, observe all variables and number of observations.
The data contains five numerical variables you will use: Sales, Quantity, Discount, Profit, Shipping Cost.
Important: Use Excel Only to observe your data, be very careful of not introducing changes to the data set.
1. Open the ALY2010 R Project you created in R Studio. If you need a review, observe file: M1_3 R Install, create folder and project.ppt.
2. Create a new R Markdown file. Name the file: Midterm_mylastname.Rmd If you need a review, observe file: R Markdown Introduction.ppt.
3. If you followed my instructions at the beginning of the class, you should be able to access the DataSets folder from the Files tab. If you need a review, observe again file: M1_3 R Install, create folder and project.ppt.
4. On the R Markdown file, create a first {r, include=FALSE} R chunk to introduce the codes for all libraries you use. Do not include install packages codes. If you need to install packages, do it directly on the console.
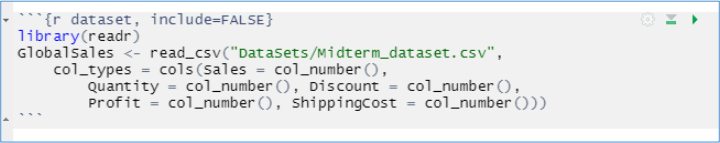
5. On the R Markdown file, create a second {r, include=FALSE} R chunk and include the codes used to import the data set into your R Markdown. Use the strategy I taught you and copy the code before clicking “Import.” Paste that code inside the R chunk. If you need a review, observe file: R Import data sets_ALY2010.ppt. Change the name of the data set to: GobalSales,
6. Now you are ready to start working with your data set.
Important: There are five (5) numerical variables in the data set, before you click “Import,” be sure to select numeric for continuous and integer for discrete data. I will help you with this code.
If you followed my instructions and created the folder sequence ALY2010 R Project/DataSets on your computer, then this code should work.
Perform all the following tasks on your R Markdown file.
Part 1. Title and Introduction
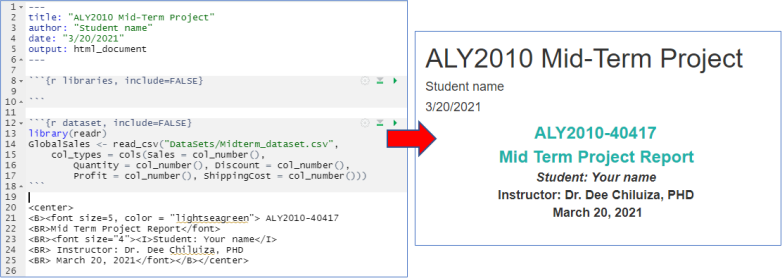
1. Title: Present a title to your report. You can use the following codes. Delete all initial codes presented on the file when you create the new R Markdown file and replace with these codes.
You can change font size and color.
2. Introduction: Present a well informative introduction section, this will measure your understanding of the topic and analytical processes for data analysis:
Your introduction needs good information and good organization. This applies for any report you make. Try to separate each topic in a paragraph.
• General topic: Show your understanding of the topic related to the data set, in this case, sales, retail marketing, and anything related to the business: corporations, global market, importance of analytics for this industry, etc. You choose the aspect you want to present to your audience. As a guide, write a paragraph of 5 to 8 lines for this topic. Here are some examples of references you can read, it is not required, it is a suggestion:
Ali, Fareeha. January 21, 2021. US ecommerce grows 44.0% in 2020. Digital Commerce 360. https://www.digitalcommerce360.com/article/us-ecommerce-sales/
Global powers of retailing 2020. Deloitte. https://www2.deloitte.com/content/dam/Deloitte/fr/Documents/consumer-business/Publications/deloitte_global-powers-of-retailing-2020.pdf
• Data set description: Briefly mention the nature of the data set you are about to use.
• Problem identification: Imagine that you work for this company and you are given this data set. Based on the information, what questions would you ask to the data to improve the company performance? Would you focus on profits, market size, product category, global sales, shipping cost? You choose the aspect is interesting to you.
• Plan: Briefly describe your plan to address the problem, in this case, the analytical and visualization tools you plan to use.
• Use references to support each aspect/information presented.
Part 2. Analysis section
Task 1. Descriptive statistics of numerical variables.
For this task, hide all codes by using {r task1, include=FALSE} R chunk, except for the final table, below an example.
Present a summary of the five numerical variables.
Create objects to obtain mean, median, standard deviation, range (calculated using max - min).
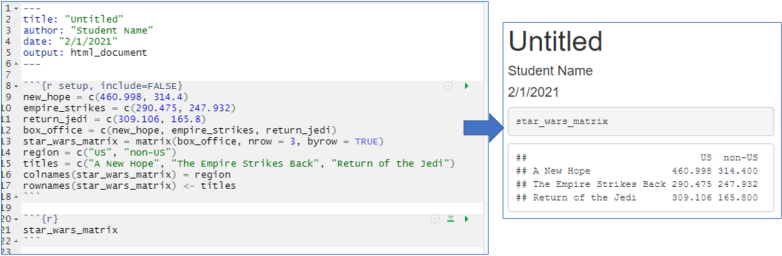
Use those objects names to create and present a 5x4 table. Use Matrix as shown in the Vectors and Martrices.R file.
Create a vector for the column names: c(the name of the 5 variables).
Create a vector for the row names: c(“Mean”, “Median”, “sd”, “Range”).
Present this table on your report.
Observe example below. First, I used an {r, include=FALSE} R chunk to prepare initial codes, then I used a regular {r} R chunk (line 20) to present the matrix I created on line 13. This should be good enough for your report. Extra bonus if you use a table package to improve presentation of your data.
Task 2, Data visualization, graphs
Numerical variables: Data distributions.
For this task, present all the codes using regular {r} R chunks.
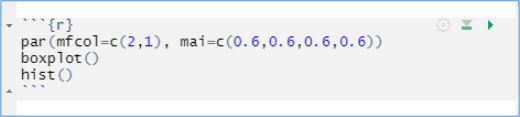
You can use the following r chunk with par() code to present the two figures together; just fill the boxplot() and hist() codes.
2.1 Create a regular {r} chunk and prepare codes to present a box plot and a histogram to display the data of GlobalSales$Sales. Remember to provide a professional presentation to your graphs. On the histogram, add at least 50 breaks.
Write a brief summary of the results you obtained.
2.2 Create a regular {r} chunk and prepare codes to present a box plot and a histogram to display the data of GlobalSales$Profit. Remember to provide a professional presentation to your graph. On the histogram, add at least 50 breaks. Remember that profits have negative values, comment on the distribution.
Write a brief summary of the results you obtained.
2.3 Create a regular {r} chunk and prepare codes to present a box plot and a histogram to display the data of GlobalSales$ShippingCost. Remember to provide a professional presentation to your graph. Add as many bins (using breaks code) as you consider necessary to the histogram.
Write a brief summary of the results you obtained.
Categorical variables: Counting observations per sub-category.
For these two tasks you will use bar plots to show how many observations there are for each group inside your categorical variables. Remember that for this task, all you need to do is to first create a table with the variable, and then use the table to create the bar graphs.
2.4 Create a table then a bar graph to display the counts of each sub-category of GlobalSales$ShipMode. Remember to provide a professional presentation to your graph.
Write a brief summary of the results you obtained.
2.5 Create a table then a bar graph to display the counts of each sub-category of GlobalSales$Market. Remember to provide a professional presentation to your graph.
Write a brief summary of the results you obtained.
2.6 Create a table then a bar graph to display the counts of each sub-category of GlobalSales$Region.
Sort the bars, when you enter the data you can use: sort(your table name), decreasing = TRUE)
Make an horizontal bar plot.
Use las = 1 to turn y-axis labels horizontal too (names of the regions).
Use cex.names = 0.5 to reduce the size of the labels in the y-axis.
Start the R chuck with par(mai=c(0.6,1.4,1,0.4)) to increase left margin (1.4) and display long names.
Remember to provide a professional presentation to your graph.
Write a brief summary of the results you obtained.
Task 3. Data analysis.
For this task, present all the codes using regular {r} R chunks.
In this task you will combine one categorical variable with one numerical variable.
Hint: Use this code to combine variables:
tapply(numerical variable name, INDEX = categorical variable name, FUN = mean)
In FUN = use mean, median, sd, sum, etc., depending on the question.
After applying tapply(), you will use the object you create to present a table and then a bar plot of the data.
3.1 Which Market has the highest Profit?
Use the tapply() code to create an object named Market_Profit and combine GlobalSales$Profit with GlobalSales$Market, e.g., Market_Profit = tapply().
In this case, use FUN =sum to calculate all profits per market.
Transform Market_Profit into a data frame and present it as a table.
Display the data using a horizontal bar plot.
Finally, make observations of the figure you obtained.
3.2 What was the mean shipping cost per department?
Similar to task 3.1, use tapply() to create an object named department_Shiping, then use the object to present a table and a horizontal bar plot to display the mean shipping cost (GlobalSales$ShippingCost) per department (GlobalSales$Department).
Make observations of the figure you obtained.
Part 3. Conclusions, References, and Appendix sections
1. Include a conclusions section.
Now that you have worked with the data, what is the data telling you? Use the conclusions section to make a global analysis of the results you obtained, make recommendation to the company, and summarize your new analytical and R-programing skills.
2. Include a Bibliography section.
Remember to list all references you used on your report. In the references section you must list ONLY those references you mentioned in your report.
What to Submit
Complete all data management tasks in R Markdown and submit this file together with your HTML report. Mention the Rmd file in the Appendix section at the end of your HTML report (appendix section).
Do not present codes in the appendix, just mention that the Rmd file is included on your report.
Due date and grade
Saturday March 20 at 11:59 PM.
Grade: 100 points.
Additional information
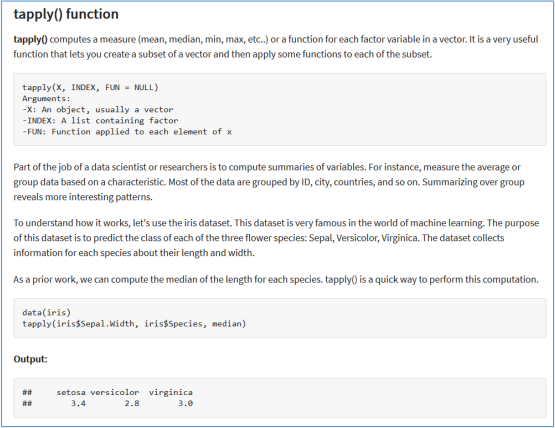
Link: https://www.guru99.com/r-apply-sapply-tapply.html#5
2021-03-18