POLS0008 Introduction to Quantitative Research Methods
UNIVERSITY COLLEGE LONDON
DEPARTMENT OF POLITICAL SCIENCE/SCHOOL OF PUBLIC POLICY
POLS0008
Introduction to Quantitative Research Methods
Final report 2020–2021
Guidelines for Completing and Submitting POLS0008 Report
■ Read the below guidelines to avoid losing unnecessary marks.
■ The assessment is due on 28 April 2021, 14.00 hours. Please follow all designated Department of Political submission guidelines. THESE MAY BE DIFFERENCE TO THOSE OF YOUR HOME DEPARTMENT. The submission guidelines are available on the Moodle page for this module. The word limit is 3,000 words, excluding tables and graphs, references, and your R script appendix (see below).
■ Name the file you submit using your 2020-21 Candidate number.
■ This is an assessed piece of coursework for the POLS0008 module; collaboration and/or discussion with anyone is strictly prohibited. The rules for plagiarism apply and any cases of suspected plagiarism of published work or the work of classmates will be taken seriously.
■ Along with the report outline, the datasets for the report can be found in the ‘Assessment Information’ folder on Moodle.
■ The data come from the Scottish Referendum Study, 2014– an internet panel survey of 4,849 Scottish adults (aged 16 and over) prior to the referendum vote.
■ You may open up the dataset and work on the report anytime up until the submission date. There is no limit on the number of times you may open the data files. Be sure to save your data file and R script file.
■ Where appropriate, answers should be written in complete sentences; no bulleting or outlining. Be sure to answer all parts of the questions posed and interpret output statistically and substantively. An attempt will almost always be worth more marks than no attempt.
■ You should include tabular and graphical output alongside your written answers.
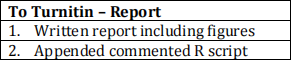
■ You are required to submit a copy of your R script appended to your report. You can copy and paste this from your R script window to the end of your word-processed document.
■ FAILURE TO SUBMIT YOUR R SCRIPT WILL INCUR A 5-POINT PENALTY. Note that your R script file should include comments indicating the question being addressed. Your R script file should contain only the exercises/questions asked here.
■ You do not need to explain the background to the study or methods of data collection.
■ You should not cite or discuss relevant literature.
■ You should discuss the interpretation of your results and how they relate to the questions you were asked.
■ You may assume the methods you have used (e.g. chi-square, t-test, correlation, etc) are understood by the reader and do not need definitions, but you do need to say which techniques you have used and why.
■ 10 points will be awarded for presentation.
Submission checklist
The data file is “scotref_2014.dta”. You can download this file in the usual way from Moodle. A brief user guide can be found here.
The variables in the “scotref_2014.dta” dataset that you might require are:

DOs and DON’Ts
- DON’T include raw variable names in the text or tables
- DON’T use too many decimal places, but be consistent
- DON’T include unedited R output or you will lose marks
- DO make sure tables and figures have titles and are referred to in the text
- DO make sure your tables and figures can be understood without reading the text
- DO make sure you have given a clear enough description of what you have done so that the reader can reproduce any numbers/results that you present
- DO be careful how you use the terms ‘significant’ and ‘correlation’ because they have specific meanings in social statistics.
Report brief
You have been commissioned by the Scottish Government to write a report on data related to interest in politics collected immediately before the 2014 independence referendum using a web-based interview. The data contain interest in politics scores (0-10) on different aspects of politics, attitudes to political matters and other individual characteristics.
You should start your report with an introduction describing the data and variables you will use and present the sample characteristics in a table before going on to answer the research questions below (10 points). Your report should end with a concluding section summarising the implications for political engagement in Scotland from your data analysis using no more than 200 words (10 points).
You should present your results using a maximum of eight figures (tables and plots). Ensure all results are interpreted substantively and statistically. You may be required to recode the data to answer certain questions. You should specify an alpha level of 0.05 unless instructed otherwise.
The Scottish Government would like you to answer their following research questions:
1. How does interest in the Scottish politics vary within and between regions in Scotland? (5 points)
- Calculate an appropriate measure of central tendency and dispersion for interest in Scottish politics for each region. Report a table and describe its contents.
2. Is the proportion who said they would currently vote for the Scottish National Party (SNP) in the Lothian region significantly different from the national average? (5 points)
- Use an appropriate statistical test to test this hypothesis regarding the proportion planning on voting SNP in Lothian compared with the national average, specifying an alpha level of 0.01. State your hypothesis and report the results of your test.
3. Is the mean interest in Scottish politics higher for people aged less than 25 compared with the national average? (5 points)
- Use an appropriate statistical test to test a hypothesis about the mean for people aged less than 25, specifying an alpha level of 0.10. State your hypothesis and report the results of your test.
4. Did those who voted SNP in 2010 think Scotland gets more or less than its fair share of UK government spending? (10 points)
- Produce a cross tabulation between whether Scotland gets its fair share of UK government spending and party voted for at the 2010 general election. Describe the table in your text and report the result of an appropriate test to determine whether there is a relationship between the two variables in your table. Comment on whether your data meet the assumptions required to conduct the test and present only a final cross-tabulation that meets these assumptions.
5. Are men more interested in Scottish politics than women? (15 points)
- Use an appropriate statistical test to test this hypothesis and demonstrate whether your data meet the assumptions to conduct the test. State your hypothesis and report the results of your test in a table. Describe whether the data meet the assumptions required for the test using the data in the table and using up to two separate plots.
6. Are the same people interested in different aspects of politics, specifically UK politics, Scottish politics and international politics? (5 points)
- Explore the descriptive strength of the relationship between interest in UK, Scottish and international politics. Report and describe an appropriate table or plot.
7. Does age predict interest in Scottish politics? (25 points)
- State your hypothesis and report a statistical model in a table. The model should enable you to explain variation in interest in Scottish politics using single year of age as an explanatory variable.
- Describe the findings from your model relating to your hypothesis.
- Use your model to predict interest in Scottish politics for an individual aged 90 and explain whether this is an appropriate prediction to make.
- Check your model for one assumption of your residual values using an appropriate test.
- Comment on the broader limitations of your model.
10 points are reserved for clear presentation and clarity of answers, especially in regards to production of tabular and graphical outputs.
■ 8-10 clear answers with outputs shown in concise format
■ 5-7 correct answers with outputs that can be understood but cumbersome
■ 0-4 confused answers with unclear outputs.
2021-03-18