STA238 - Winter 2021 Assignment 4 Instructions
STA238 - Winter 2021
Assignment 4 Instructions
Samantha-Jo Caetano
Instructions
This is a group assignment. You are expected to work on this in a group of up to for 4. Your group-mates can consist of students in either lecture section. You are expected to work exclusively with your group-mates and not other groups. You are more than welcome to discuss ideas, code, concepts, etc. regarding this assignment with your class mates. Please do not share your code or your written text with peers outside of your group. It is expected that all code and written work should be written by members of your group (unless they are taken from the materials provided in this course or are from a credible source which you have cited). You have the option to work in a group of smaller than 4, but please note that we do not recommend this, as the workload of this assignment is for groups of size 4. Please note, this assignment is fairly open, so the context of most of the work completed here should not match that of other groups. There is a starter Rmd file (called Assignment4.Rmd) available for you to use to start your code.
Submission Due: Friday March 19th at 11:59pm ET
Your submission will consist of three components:
1. .Rmd file (submitted as a Group)
2. .pdf file (submitted as a Group)
3. Completion of Assignment 4 - Group Work Survey (completed as an individual)
Group Submission
Your group will submit one .Rmd file that you created for this assignment AND the resulting pdf (i.e., the one you ‘Knit to PDF’ from your .Rmd file) must be uploaded into a Quercus assignment (link: https: //q.utoronto.ca/courses/204754/assignments/569763) by 11:59PM ET, on Friday, March 19th.
Please note that only one group member needs to submit the .Rmd and .pdf files onto Quercus in ONE submission. We will be directly marking on the LATEST submission of the .pdf (submitted on/before the due date/time). If your LATEST submission does not contain a .pdf AND an .Rmd then you will receive a 0 on this Assignment. All group members will receive the same grade.
Late assignments are NOT accepted. Please consult the course syllabus for other inquiries.
Individual Item to Submit
In order to keep a record of group contributions there is a survey (link: https://q.utoronto.ca/courses/ 204754/quizzes/158869) . Please complete this survey between Thursday March 18th 12:01am ET and Monday March 22nd at 11:59pm E.T. Completion of this survey will be worth 1% of this assignment. The survey should not take more than 5 minutes to complete. So NO LATE submissions will be accepted (i.e., no submissions of the survey beyond Monday March 22nd at 11:59pm E.T.). There is no time limit on the survey, but you must submit it before March 22nd at 11:59pm ET. You have one attempt/submission of this survey.
This survey must be completed by ALL STUDENTS (even if you are working on Assignment 4 as an individual).
Assignment grading
This is a Group assignment. All group members will receive the same grade on the Group submission for this assignment (i.e., the pdf and Rmd submission). The 1% completion point for the survey is awarded to individuals who complete the survey. If there is a lot of evidence of little to no contributions by individual group members then those individuals may receive a lower grade than their group-mates.
There are two parts to this assignment. One is theory-based and the other is data analysis and communica-tion/writing focused. We recommend you spellcheck and proofread your written work. We will be directly marking the pdf files, thus please ensure that your final submission looks as you want it to look before submitting it. We will be marking the LATEST submission of the pdf files.
As mentioned above, this assignment will be marked based on the output in the pdf submission. You must submit both the Rmd and pdf files for this assignment to receive full marks in terms of reproducibility. Furthermore, this is a GROUP assignment. You are expected to work in a group. The workload level is higher than that of an individual assignment. Thus, it is recommended that you work in a group (i.e., not on your own).
This assignment will be graded based off the rubric available on the Assignment Quercus page (link: https: //q.utoronto.ca/courses/204754/assignments/569763). TAs will look over each section (on the submitted pdf) and select the appropriate grade for that section based off a coarse overview (one-time read over) of that section (of the pdf). Your assignment should be well understood to the average university level student after reading it once. I would suggest you make sure your (pdf) document looks clean, aesthetically pleasing, and has been proofread. You will be able to see the rubric grade for each section. There may be some comments/feedback provided (by the TAs) if the same issue seems to be arising in multiple sections, but you will likely receive no comments/feedback (due to the scaling of the class and marking).
Part 1
Description
Recall from Assignment 2 that the sample variance defined as:  is unbiased for σ2. And we answered “Why are we dividing by n − 1 and not n?”. Now let’s take this one step further and investigate if either of the estimators in Assignment 2 Part 1 is a maximum likelihood estimator of σ2.
Step 1 (Mathematical Justification)
Assume that  , derive the maximum likelihood estimator of σ2.
NOTE: In this derivation you should: 1. explicitly identify the likelihood function (in a simplified form); 2. explicitly identify the loglikelihood function (in a simplified form); 3. use the second derivative test to ensure that the estimator is indeed a maximum; and 4. make sure you are differentiating with respect to σ2 (and not with respect to σ).
Step 2 (Simulation Justification):
Compare the likelihood (or loglikelihood) of σ2 when evaluated at the two estimators
.
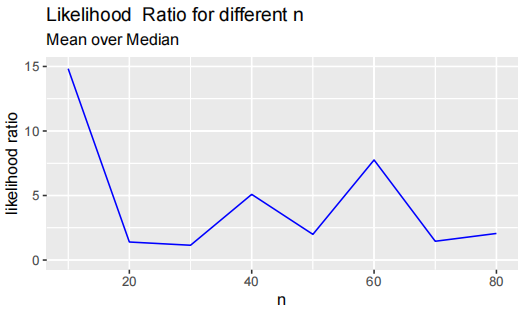
Here you will simulate n Normal(0, σ2) random variables to represent your data. Select (at least) 10 different sample sizes. For each simulated sample (i.e, for each n) evaluate the likelihood at T1 and T2 and plot the ratio of these two likelihoods for the different n. So n is on the x-axis, and the ratio of the likelihoods is on the y-axis. So one plot is for one σ2 and the 10 (or more) different sample sizes. Repeat this for another σ2 (I would recommend choosing 2 different values for σ2 one “large” and one “small”). You can put both lines on one plot (make sure it’s clear which plot is for which σ2 ) or put each line on it’s own plot.
Once these plots are created provide some commentary on whether your simulation results are inline with your derivations in Step 1.
Here is an example of one of the lines-plots for the comparison of the likelihood. This example is for data that is exponential with parameter (mean) θ. The likelihood is evaluated at the sample median and sample mean (the MLE). The code to produce this is in the Assignment4.Rmd.
General Notes (for Part 1):
• This question is open book, so you can use outside sources (i.e., textbooks, academic papers, credible websites, etc.), especially in Step 1, to prove/show the MLE derivation. Just make sure you properly credit any outside sources.
• You will likely need to use LaTeX code in your Rmd file. Please have a look at our course Resources page, as well as the synchronous lecture in Week 4.
• Grammar is not the main focus of the assessment, but it is important that you communicate in a clear and professional manner. I.e., no slang or emojis should appear.
• You may want to include a bibliography in this section. If it is clear that you (or the reader) looked up something that is not common knowledge (and it was not cited) then you will lose points.
• Use inline referencing
Part 2
Description:
In this question you will write a report on a data analysis in which your main methodology will be to derive at least two confidence intervals. One confidence interval should be for a mean and should be calculated via critical values (i.e., NOT via bootstrapping). The other confidence interval should be for another measure, that is not the mean, median, or a proportion (e.g., a percentile, ratio, variance, standard deviation, etc.) to be calculated via bootstrapping. Both confidence intervals should be meaningful/appropriate based on the data. The report will consist of 5 sections: Introduction, Data, Methods, Results, and Conclusions.
There should be no evidence that Part 2 is an assignment, I should be able to take a screenshot of this section and paste it into a newspaper/blog. There should be no raw code. All output, tables, figures, etc. should be nicely formatted.
This will allow you to look at some interesting aspects of the data. Please find some data through:
1. The Statistics Canada Portal (https://www150.statcan.gc.ca/n1/en/type/data) and download it via the statCanR R package (https://cran.r-project.org/web/packages/statcanR/vignettes/statCanR. html).
Make sure that the data is appropriate for your methods. Pick something that is interesting to investigate and has variables appropriate for the methodology you are going to perform. NOTE: If your data is not appropriate in performing two CIs then you will not be eligible for full marks on this assignment. Please visit office hours, post on Piazza or email our teaching team at [email protected] for clarification on appropriate data.
If you use data NOT from the Statistics Canada Portal you will receive a 0 on this assignment. (I.e., do NOT use data from open Toronto data on this assignment; do NOT use data from CES on this assignment)
This is a different portal with different data than that on Assignments 1, 2, and 3. Thus, the material and text on this assignment should be different from that of your previous assignments in this course. Thus, you should NOT directly copy your previous assignment work. We highly encourage you use feedback from previous assignments to amend/proofread/update your Assignment 4. If your work is a direct copy of a previous submission or is a direct copy of another group’s submission this is considered an academic offense.
Some of the stand-alone data in the portal is fairly simple, so you may want to use more than one data set. You can merge them or just analyze them separately. If you do this, try to pick data that are related (e.g., Data1: is on Household Income and Data2 is on Household Spending).
Introduction
The goal of the Introduction section is to introduce the overall “problem” to the reader.
Your Introduction section should include the following:
• Describe the data and the problem in 2-3 clear sentences.
• Should introduce the importance of the analysis.
• Get the reader interested/excited about analysis.
• Provide some background/context explaining the global relevance of the problem/data/analysis.
• Introduce terminology and prep the reader for the following sections.
• Introduce hypotheses.
Data
The goal of the Data section is to introduce the reader to the data set, showcase some meaningful aspects of the data, and get them thinking about potential hypotheses/findings.
Your Data section should include the following:
• A description of the data collection process.
• A summary of the cleaning process (if you cleaned the data).
• A description of the important variables.
• Some appropriate numerical summaries (at minimum center and spread, but something else may be more appropriate). If there are a lot, please put them in a well formatted and labelled table.
• At least 1 aesthetically pleasing plot/graph/figure (No more than 4 plots).
• Text explaining/highlighting each table or figure.
• Some text (and perhaps graphical summaries) of the variables you will perform the bootstrap on (don’t do the bootstrap here - just prep the reader for what is coming in later sections). This should help prep the reader in understanding why the CI is important/interesting and whether it is appropriate.
• In line referencing/text if needed.
• Reference the programming language/software used to complete this section.
Methods
The goal of the Methods section is to introduce the reader to the statistical methods that you will be using to analyze the data.
Your Methods section should include the following:
• A complete explanation of what a confidence interval for the mean is.
• Explain if you are using a t or Z.
• Explain any assumptions.
• An explanation of what bootstrap sampling is.
• You should clarify if you are using Empirical or Parametric bootstrap sampling (and be sure to appro-priately describe your selected method).
• An explanation of the confidence intervals which you will use to analyze the data.
• An explanation of the parameters of interest (i.e., mean and variance/percentile/etc).
• Reference any packages/software used to complete this section.
Results
The goal of the Results section is to present the results of the bootstrap CIs to the reader.
Your Results section should include the following:
• The results of the two (or more) CIs (I would recommend putting them in a table if there are a lot).
• An explanation/interpretation of the results.
• Some commentary on whether or not the results seem reasonable.
• Text explaining/highlighting each table or figure.
• In line referencing
• In line R code (if needed).
Conclusions
The goal of the Conclusions section is to present the story of your analysis to the reader.
Your Conclusions section should include the following:
• A brief recap of the hypotheses, methods, and results.
• State (or re-iterate) your key results.
• State any reasonable conclusions drawn from the results.
• An explanation/interpretation of the results.
• Some commentary on any drawbacks/limitations.
• Recommendations for Next Steps for future analyses/reports.
General Notes (for Part 2):
• Some of the stand-alone data in the portal is fairly simple, so you may want to use more than one data set. If you do this, try to pick data that are related (e.g., Data1: is on Household Income and Data2 is on Household Spending).
• It is expected that you include two CIs in your report, but you can include more (i.e., maybe you want to look at more variables).
• All tables/figures should be well labelled and clean.
• Everything in Part 2 should be written in full sentences/paragraphs.
• There should be no evidence that Part 2 is an assignment, I should be able to take a screenshot of this section and paste it into a newspaper/blog.
• There should be no raw code. Any output should be nicely formatted.
• You will also need a reference section. You should reference the data, any outside code/documentation and any ideas/concepts that are taken outside of the course.
• Note, we are not marking grammar, but we are looking for clarity. If you need help with writing there are resources posted on the Course Info>Resources page of Quercus. It is important that you communicate in a clear and professional manner. I.e., no slang or emojis should appear.
• Use full sentences.
• Be specific. Remember, you are selecting this data and the reader/marker may not be familiar with it. A good principle is to assume that your audience is not aware of the subject matter.
• Remember to end with a conclusion. This means reiterating the key points from your writing.
2021-03-17