DATA7202 Statistical Methods for Data Science
Statistical Methods for Data Science
DATA7202
Semester 1, 2021
Assignment 1 (Weight: 25%)
Assignment 1 is due on 22 Mar 2021 17:00).
Please answer the questions below. For theoretical questions, you should present rigorous proofs and appropriate explanations. Your report should be visually appealing and all questions should be answered in the order of their appearance. For programming questions, you should present your analysis of data using Python, Matlab, or R, as a short report, clearly answering the objectives and justifying the modeling (and hence statistical analysis) choices you make, as well as discussing your conclusions. Do not include excessive amounts of output in your reports. All the code should be copied into the appendix and the sources should be packaged separately and submitted on the blackboard in a zipped folder with the name:
"student_last_name.student_first_name.student_id.zip".
For example, suppose that the student name is John Smith and the student ID is 123456789. Then, the zipped file name will be John.Smith.123456789.zip.
1. [15 Marks] Repeat the advertisement exercise with the following changes.
(a) The data is generated via the following data generation mechanism.
~ U(0, 1) for i ∈ {1, 2, 3}; here U(0, 1) stands for the continuous uniform distribution over the [0, 1] set. However, we require that
+
+
= 1, that is, the explanatory variables stand for a percentage of the budget.
(b) In addition, the model for y is as follow:

where W ~ U(0, 1).
Similar to the original example, generate train and test sets of size N = 1000. Fit the linear re-gression and the random forest models to the data. For the linear regression, make an inference about the coefficients, specifically, comment about the contributions of different advertisement types to sales. Use the linear model and the RF (with 500 trees), to make a prediction (using the test set), and report the corresponding mean squared errors.
When constructing datasets, please use “1” and “2” seeds for the train and the test sets, respectively.
2. [10 Marks] Consider the following variant of the cross-validation procedure.
(i) Using the available data, find a subset of “good” predictors that show correlation with the response variable.
(ii) Using these predictors, construct a model (for regression or classification).
(iii) Use cross-validation to estimate the model prediction error.
Is this a good method? Do you expect to obtain the true prediction error? Explain your answer.
3. [5 Marks] Suppose that we observe  , . . . ,
  ~ F. We model F as a normal distribution with mean µ and standard deviation of σ. For this problem, determine the hypothesis class
and state explicitly what is θ and Θ.
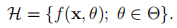
4. [15 Marks] Let  be a class of binary classifiers over a set
  . Let
. Let  be an unknown distribution over
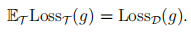
  , and let g be a target hypothesis in . F Show that the expected value of
  over the choice of
  equals
  , namely,
5. [15 Marks (see details below)] Consider the following dataset.
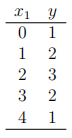
Now, suppose that we would like to consider two models.
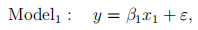
and
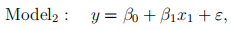
where  ~ N(0, 1). That is, we consider two linear models with and without the intercept.
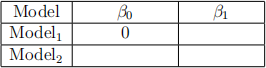
(a) [5 Marks)] Fit these models tot the data and write the corresponding coefficients. Namely, fill the following table:
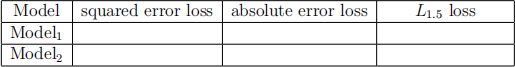
(b) [5 Marks)] Consider the squared error loss, the absolute error loss, and the
loss. Find the average loss for each model. Namely, fill the following table:
(c) [5 Marks)] Draw a conclusion from the obtained results.
6. [30 Marks (see details below)] Consider the Hitters data-set (given in Hitters.csv). Our objective is to predict a hitter’s salary via linear models.
(a) [5 Marks)] Load the data-set and replace all categorical values with numbers. (You can use the LabelEncoder object in Python).
(b) [5 Marks)] Generally, it is better to use OneHotEncoder when dealing with categorical variables. Justify the usage of LabelEncoder in (a).
(c) [20 Marks)] Fit linear regression and report 10-Fold Cross-Validation mean squared error.
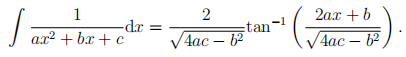
7. [10 Marks)] Consider a function
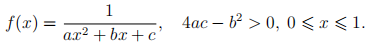
 > 0, the
  value
value
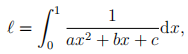
is given by:
 (2)
(2)
Suppose that a = 1, b = 2, and c = 3, and write a Crude Monte Carlo algorithm for the estimation of using N = 10000 sample size. Deliver the 95% confidence interval. Compare the obtained estimation with the true value as given in (2).
2021-03-16