MT2508 Computer Project 2020/21
MT2508 Computer Project 2020/21
Success rate of drug treatment
This project will count for 15% in total of the final mark for the module. The project is divided in two parts - a moodle quiz worth 7% and a report worth 8%. The marks available for each question are given in [ ] brackets. Please complete the moodle quiz AND upload the second part as a single .R file (i.e. a file saved from the editor of R-Studio) to moodle by 2pm Friday 19th March (Week 8) . You should work on the project in your own time and attend the Computer Classroom sessions in Weeks 5-8 to receive help if needed.
A pharmaceutical company wants to investigate the success rate of a new drug. The success rate of an already established drug produced by a rival company is 90%. The company designs an experiment to investigate if the success rate of their new drug is different to 90%. A total of 67 patients receive the drug with 62 successful and 5 unsuccessful treatments recorded.
Let X denote the number of successfully treated patients on the new drug and p the probability of a successful treatment on the new drug. We denote the total number of patients by n.
MOODLE QUIZ
A correct answer for the questions will bring you 100% of the mark. An incorrect answer for the multiple choice questions has a penalty of 20% of the mark. Open questions have no penalty for incorrect answers.
Q1. Calculate a point estimate, ˆp, for the probability of a successful treatment on the new drug. Round your answer to four decimal places.
[1 mark]
Q2. Your aim is to generate 1000 values from a Binomial distribution with parameters n and ˆp and using the simulated random deviates to identify an approximate 95% confidence interval for the true success probability of the new drug p.
Which of the following commands is most suitable for this purpose?
Note that in the code below phat is the estimated porbability from Question 1.
a) quantile(rbinom(1000, size=67, prob= phat), probs=c(0.025, 0.975))
b) rbinom(1000, size=67, prob=phat)
c) quantile(rbinom(1000, size=67, prob= phat), probs=c(0.025, 0.975))/67
d) quantile(rbinom(1000, size=67, prob= phat), probs=c(0.05, 0.95))/67
[1 mark]
Q3. For this question assume that the interval you calculated in the previous question is [0.75;0.98].
Which interpretation of this interval is correct?
a) The true success probability of the new drug lies in the intreval [0.75;0.98] with porba-bility 95%.
b) We are 95% confident the range 0.75 to 0.98 contains the true success probability of the new drug.
c) If the simulation procedure is replicated 100 times and each time a confidence interval is calculated, then exactly 95 of these intrevals will contain the true success probability of the new drug.
d) None of the provided interpretations.
[1 mark]
Q4. State the appropriate Normal approximation for X (as a function of p).
a) X is approximately Normal with mean p and variance p(1 1 p)
b) X is approximately Normal with mean 67p and variance p(1 1 p)
c) X is approximately Normal with mean p and variance 67p(1 1 p)
d) X is approximately Normal with mean 67p and variance 67p(1 1 p)
[1 mark]
Q5.-Q6. Using your Normal approximation calculate a 95% confidence interval for p.
[1 mark]
Q7. Comparing the Normal approximation interval with the interval obtained in Question 2, which of the following statements is FALSE?
a) The confidence interval from the Normal approximation is similar to the interval from Question 2.
b) The Normal approximation intreval is symmetric around the point estimate.
c) The confidence interval based on the simulation from Question 2 is symmetric about the point estimate.
d) The confidence intreval from Question 2 can be wider or narrower than the Normal approximation interval, depending on the random simulation.
[1 marks]
Q8.-Q9. Using the rule of thumb for the validity of the normal approximation, determine the range of values the true parameter p, for which the approximation is considered to be valid. Round your answer to four decimal places.
[1 mark]
Q10. Based on your result from the previous question, decide whether the following statement is TRUE or FALSE:
There are no reasons for concern about the validity of the Normal approximation.
[1 mark]
Q11. This question is not directly related to the drug investigation. The purpose of this question is to demonstrate that if we repeat an experiment k times, we expect in the long run k(11 α) of the derived 100(1 1 α)% confidence intervals to contain the true value of some parameter θ. While it is the case that we normally have only one sample of data available to us in practice, we can use computer simulation to simulate taking many samples from a defined population.
(a) Assume we have a population that is normally distributed with µ = 82 and σ 2 = 20. Your task is to simulate 100 samples each of size n = 1000 from this population and store the samples.
Give the steps you will need to undertake to complete the task in logical order from the start (Step 1) until the end (Step 3). One of the steps is superfluous. [1 mark]
a) Step 1
b) Step 2
c) Step 3
Answers to match the steps:
∗ Store the generated output in a matrix.
∗ Sample 100 from the simulated normal variables
∗ Define the simulation parameters.
∗ Generate 100 * 1000 normal variables.
(b) Let data.sim be the 100 × 1000 matrix which stores the samples from the previous question. The columns of the matrix contain each sample.
Your next task is to compute for each sample the sample mean, the lower and upper bound of a 95 % confidence interval for µ (assuming both µ and sigma2 are unknown) and store the results.
Choose the correct command for each step in this process. [1 mark]
a) Create an empty matrix to store the point estimates, the upper and the lower bound of the conifidence intervals obtained from each sample.
b) Calculate the sample mean for each sample.
c) Calculate the standard error for each sample.
d) Calculate the upper bound of the confidence interval.
e) Calculate the lower bound of the confidence interval.
f ) Show the first 6 rows of the output matrix.
Answers to match the steps:
∗ res.sim[,2] = res.sim[,1] + qt(0.025, 1000-1)*s
∗ mu = apply(data.sim, 1, sum)/sqrt(1000)
∗ res.sim = matrix(0, nrow=100, ncol=3)
∗ res.sim[,1] = rowMeans(data.sim)
∗ res.sim[,3] = res.sim[,1] + qt(0.975, 1000-1)*s
∗ s = apply(data.sim, 1, sd)/sqrt(1000)
∗ head(res.sim)
(c) Let res.sim be the output from the previous question. What do the three lines of code below exactly do?
a) Check whether the upper bound is larger than the lower bound.
b) Check whether the true value of the parameter is within the interval bounds.
c) Give the number of intervals that contain the true value of the parameter.
d) Count how many times the true value is above the lower limit.
[1 mark]

(d) For the calculation of the confidence intervals quantiles from part (b) of the t distribution are used because...
a) We assumed that the variance σ 2 is unknown.
b) The sample size is greater than 30.
c) The number of samples is too small.
d) The sample mean is not normally distributed.
[1 mark]
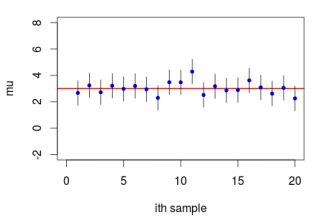
(e) You will now display the confidence intervals graphically. Plot your 100 confidence intervals for µ with the estimate of the sample mean marked by a dot for each sample.
Add to your plot a line indicating the true value of µ = 82. Colour the intervals (and dots) that do not contain truth a different colour to those that do. (Hint: Your plot should look similar in style to the plot given below. I suggest constructing the plot one step at a time using a series of commands rather than in one single step.)
Save your plot and upload it to Moodle. Use sensible axis labels and give your plot a title. Your file should be one of jpeg, png or pdf. Provide your code in the text box.
[2 marks]
Report
For the remaining question you will need to submit a written code. Please upload this part of your project as a single .R file (i.e. a file saved from the editor of R-Studio) to moodle by 2pm Friday 19th March (Week 8) . You should use comments within your code to indicate which question is being addressed, to indicate what the code is doing and to answer any questions that require an explanation. For example:

Q12. Returning to the drug effectiveness investigation, we wish to perform a hypothesis test to see whether there is a difference in the success rate of the established and new drugs. In performing this hypothesis test we will not use a normal approximation. State the null and alternative hypothesis for such a test in terms of an appropriate parameter. Choose and state your choice of an appropriate test statistic. State the distribution of your test statistic under the null hypothesis.
[2 marks]
Q13. Calculate a p-value for the hypothesis test you defined in Question 12 using the approaches detailed below:
(a) Using the p and/or q distributional commands, calculate an exact p-value for the hypoth-esis test directly from the distribution of your test statistic under the null hypothesis. [1 mark]
(b) Simulate a large number of values (at least 1000) from the distribution of your test statistic assuming the null hypothesis is true. Plot these values as a histogram marking the observed value by a labelled vertical line. Use the simulated sample to obtain an approximate p-value.
[2 marks]
Q14. Calculate the power of the hypothesis test from Questions 12 and 13 at p = 0.7 and p = 0.95. By considering many different values of p plot the power function of the test.
[3 marks]
Q15. We will now consider hypothesis tests and the power funtion in more detail. The problems given below can be answered using the taught material and some independent thought.
(a) Calculate the smallest sample size needed such that the null hypothesis in Question 12 is rejected at the 5% significance level using the observed success rate of the new drug. If, for some sample sizes, ˆp% of the patients does not correspond to an integer, take the integer part of the value as the number of successful treatments (round down to the last whole integer). Use comments to describe what your code is doing. [2 marks]
(b) Calculate the smallest sample size required such that the power of the test is greater than 0.7 for all values of the true success probability p beyond 0.05 of the null hypoth-esis when the significance level of the test is 5%. Use comments to describe what your code is doing. [2 marks]
(c) Modify the code you used to answer Part (b) to turn it into a function. The function should have a single argument that is the smallest difference between the null and the true value of p you wish to consider (this was 0.05 in Part (b)). The function should return the minimum sample size such that the power of the test is greater than 0.7 for all values beyond the smallest difference when the significance level of the test is 5%. Use your function to find the minimum sample size required when the smallest difference is 0.05 (you should obtain the same answer as in Part (b), this will show you your function is working). Once you are certain the function is working as intended find the minimum sample size required when the smallest difference is 0.1 and 0.02. [3 marks] *Note that functions are usually created for more general use when the same job may be required multiple times for different values and will often have more than one ar-gument. In this instance I am asking for a function with only one argument to make the programming more straightforward, you may wish to investigate generalising your function further but there are no additional marks available for doing so. *
If the submitted code is written in a tidy and understandable way, [1 mark] will be given.
2021-02-28