STAT430 - Spring 2021
STAT430 - Spring 2021
Homework Assignment 2 – Topics 02 and 03
Problem 1 (2 points): Filtering/Subsetting
Given the following data set, called ds_exercise_01, answer items a) and b). Item c) is extra.
|
vendor_id
|
name
|
contract_sign_date
|
total_spend
|
|
1
|
vendor_schmendor
|
2018-09-01
|
34324
|
|
2
|
parts_r_us
|
2018-09-03
|
23455
|
|
3
|
vendor_king
|
2018-10-11
|
77654
|
|
4
|
vendor_diagram
|
2018-08-21
|
23334
|
|
5
|
venny
|
2018-08-13
|
94843
|
|
6
|
vendtriloquist
|
2018-10-29
|
23444
|
a) (1 point) Write a SAS code to return only the vendors in which name starts with the letter “v” AND only the columns name and total_spend. YOU DON’T NEED TO PASTE THE OUTPUT TABLE, I NEED ONLY THE CODE.
b) (1 point) Write a SAS code to KEEP all the rows where the contract_sign_date is between 2018-09-01 and 2018-10-13 (inclusive). YOU DON’T NEED TO PASTE THE OUTPUT TABLE, I NEED ONLY THE CODE. Hint: to subset using dates in SAS, you need to write your clause with dates in the date9. format, in quotes, and followed by the letter d. For example, for dates after 2020-02-10, you’d write if contract_sign_date > ‘10Feb2020’d ;
Here is the code to create the data set, to help you get started:
DATA ds_exercise_01;
LENGTH vendor_id 3 name $ 32;
INPUT vendor_id name $ contract_sign_date yymmdd10. total_spend;
FORMAT contract_sign_date yymmddd10.;
DATALINES;
1 vendor_schmendor 2018-09-01 34324
2 parts_r_us 2018-09-03 23455
3 vendor_king 2018-10-11 77654
4 vendor_diagram 2018-08-21 23334
5 venny 2018-08-13 94843
6 vendtriloquist 2018-10-29 23444
;
RUN;
Problem 2 (1 point): Merging Data Sets
– Consider the following two data sets, data_A and data_B.
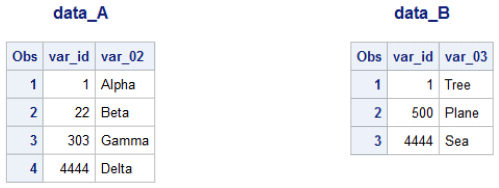
Suppose you run the following code:
DATA data_A_merge_B;
MERGE data_a (in = A) data_b (in = B);
BY var_id;
IF A AND B;
RUN;
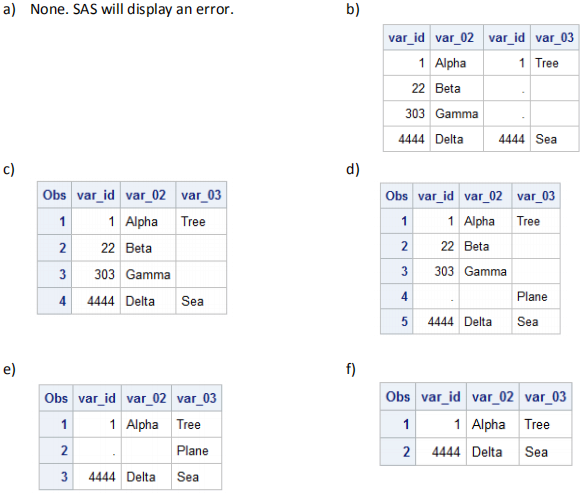
Which of the following is the correct data set data_A_merge_B:
Problem 3 (2 points): Accessing Data Through Libraries
Use the data set called cars inside the library sashelp to answer the following questions:
a) (1 point) How many cars have horsepower > 200 ?
b) (1 points) What car model and make has the largest difference between MSRP and Invoice? (Hint: use PROC SORT with the BY DESCENDING option).
Problem 4 (2 points): Categorizing rows
Obs.: These types of questions are common in job interviews.
You are given the following data set, called food_weight, and are asked to categorize each food into 1 of 3 categories: meat, fruit, or other.
|
pounds
|
food
|
pounds
|
|
4.0
|
bacon
|
4.0
|
|
3.5
|
STRAWBERRIES
|
3.5
|
|
7.0
|
Bacon
|
7.0
|
|
3.0
|
STRAWBERRIES
|
3.0
|
|
6.0
|
BACON
|
6.0
|
|
9.0
|
strawberries
|
9.0
|
|
1.0
|
Strawberries
|
1.0
|
|
3.0
|
peanuts
|
3.0
|
Given this, write SAS code to add a new column categorizing each row. Return this code.
Hint: The upcase function might make your IF-ELSE statement shorter. Don’t forget to set the length of the new category variable.
Problem 5 (2 points): Merging – Keep data from first data set only (also known as left merge/join)
Obs.: These types of questions are common in job interviews.
Suppose you work for a retail company and have access to two tables:
Table 1: customers
|
customer_id
|
city
|
|
A1
|
New York
|
|
B7
|
Miami
|
|
G5
|
Los Angeles
|
|
E8
|
Jacksonville
|
Table 2: suppliers
|
supplier_id
|
city
|
|
S00764
|
Omaha
|
|
S00089
|
New York
|
|
S10522
|
Los Angeles
|
Write a code that merges this two tables, keeping only the observations from customers.
(Hint: Don’t forget to sort the data sets)
Problem 6 (6 points):
The following information comes from the GitHub of Simon Jockers and the TidyTuesday Github Repo. Simon used the datasets to write this article: The best hip-hop songs of all time, visualized.
“Earlier this year, BBC Music asked more than 100 critics, artists, and other music industry folks from 15 countries for their five favorite hip-hop tracks. Then they broke down the results of the poll into one definitive list. But BBC Music didn’t just publish a best-of list, they also published the complete poll results and a description of the simple algorithm they ranked the songs with.” - Simon Jockers
“We awarded 10 points for first ranked track, eight points for second ranked track, and so on down to two points for fifth place. The song with the most points won. We split ties by the total number of votes: songs with more votes ranked higher. Any ties remaining after this were split by first place votes, followed by second place votes and so on: songs with more critics placing them at higher up the lists up ranked higher.” - BBC Music
Data:
• rankings.csv: Complete ranking (310 songs, ranked by critic rating)
URL:
https://raw.githubusercontent.com/rfordatascience/tidytuesday/master/data/2020/2020-04-14/rankings.csv
• polls.csv: Complete poll data (535 entries by 107 critics and music industry folks)
URL:
https://raw.githubusercontent.com/rfordatascience/tidytuesday/master/data/2020/2020-04-14/polls.csv
Use the code found at “STAT430-SPRING2021/Topic 02 - Data Access/code/topic02_import_from_github.sas” to import the csv files to a SAS table.
Return a table (with ODS RTF) that contains the rank, the song title, the artist, the artist’s gender, the year the song was released, the name of the critic and their role and country, and the number of times a song was voted as #1, but only for the song that got the most votes as #1. Use the data dictionary found at TidyTuesday to help you with the variables names and what they measure.
Hint: It’s easier if you break down the problem in small parts, like:
1. Import both data sets;
2. Think about which variables you should use to merge the two data sets. For instance, if you decide to merge them using only “song title”, think about what would happen if two different artists had the same song title. Another problem is that artists my re-release songs in different years (for example, a remaster). Select the variables to use in your merge to make sure that these types of problems won’t happen;
3. Sort the two datasets by the variables from “2” (don’t forget to use the OUT = option);
4. Merge the two datasets. You can use the DROP/KEEP options here to select only the variables you need to return;
5. Find out which song got the greatest number of votes as #1 (Hint: Look at Problem 3-b);
6. Print the final table (Hint: Use the WHERE statement). This table should have 18 rows and
9 columns. Changing the font size to 10 should make the table fit nicely in your report page.
2021-02-23