MAS 627 - Homework 1
MAS 627 - Homework 1
Your Name Here
Due Monday, February 8th by Midnight
Please submit BOTH your .RMD file and the knitted PDF file to Blackboard.
Instructions
• One line of code per question (Parts 1 and 2).
• R output is enough for an answer, you do not need to additionally type the answer to each question.
• No entering numbers manually.
• Example: What percent of people like the color yellow?
– Good: mean(favColor=='Yellow') <- this will remain correct if data changes
– Bad: 6/15, after looking at data and determining 6 of the 15 had yellow as favorite color
– Bad: sum(favColor=='Yellow')/15 <- this will be incorrect if the data changes
• No unnecessary or irrelevant output in your document. Keep it organized, relevant, and well formatted.
Part 1
stateData <- read.csv('https://douglas2.s3.amazonaws.com/data/stateData.csv')
1. What is the dimension of this data set?
2. What variables does it contain?
3. Rename only the variables Life.Exp and HS.Grad to LifeExp and HSGrad (one line!).
4. What is the mean population size?
5. What is the total area of the United States?
6. How many states are in the ‘West’ region?
7. Use the table() function to see how many states are in each region.
8. What percent of states are in the ‘Northeast’ region?
9. What is the total area of the ‘North Central’ region?
10. Using tapply(), determine the total area of each region.
11. Which states have the lowest illiteracy rate?
12. Which states in the South have above average income (national average)?
13. Which states have an area of over 100,000 square miles, life expectancies greater than 70 years, and more than 50% high-school graduates?
14. Which 3 states have life expectancies over 73 years or murder rates per 100,000 less than 2%?
Part 2
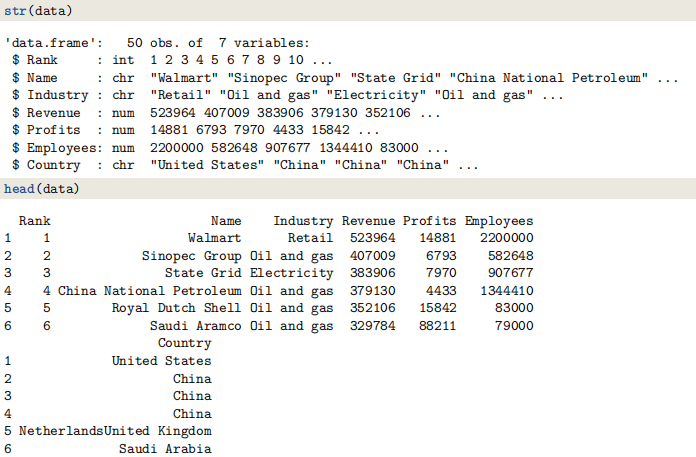
• Read in the Largest Companies by Revenue Wikipedia page using the htmltab package/function.
– Data can be found here - https://en.wikipedia.org/wiki/List_of_largest_companies_by_revenue
• Data contains information on the 50 largest companies by revenue.
• Convert the data into the format given below.
– Pay attention to variable types.
Additional Questions:
1. What is the average revenue by industry?
2. What proportion of these companies are in the Oil and Gas industry?
3. How many employees are employed by the 10 largest (by revenue) companies? Note that the data is already sorted high to low by revenue.
4. What percent of total revenue does the financial industry capture?
5. What percent of oil and gas companies are based in the United States?
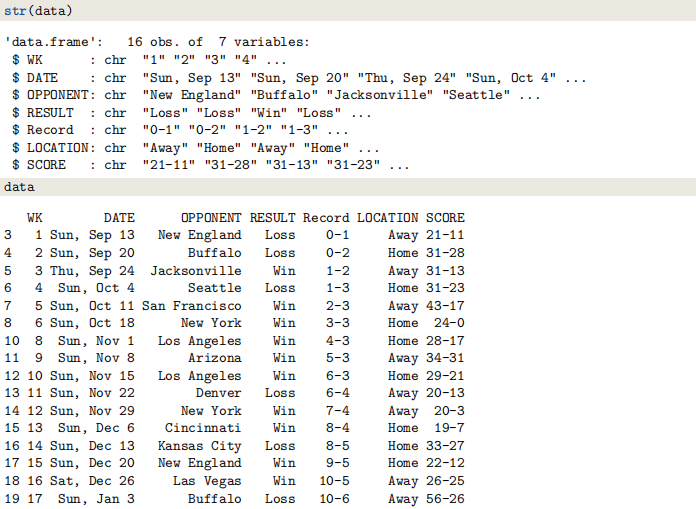
Part 3
The data for Part 3 represents the Miami Dolphins schedule page from ESPN, located here - https://www. espn.com/nfl/team/schedule/_/name/mia. It looks a bit hectic when you read it in, but if you look at it online you should see what is going on - Preseason stuff at the bottom, Regular season at top. You need to extract and clean the regular season table.
• Don’t be afraid of trial and error. You can always re-read in the dataset if you accidentally overwrite something.
• vs/@ in the Opponent variable corresponds with Home/Away
2021-02-05