STA106 Analysis of Variance: Assignment 4 2022
Hello, dear friend, you can consult us at any time if you have any questions, add WeChat: daixieit
STA106 Analysis of Variance: Assignment 4
2022
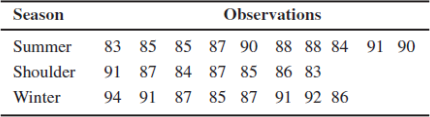
Problem 1 (30 pt) Woody belongs to a golf club. He divides the year into three golf seasons: summer (June–September), winter (November–March), and shoulder (October, April, and May). He believes that he plays his best golf during the summer (because he has more time and the course isn’t crowded) and shoulder (because the course isn’t crowded) seasons, and his worst golf is during the winter (because when all of the part-year residents show up, the course is crowded, play is slow, and he gets frustrated). Golf scores from the last year are shown in the following table.
1) (20 pt) Do the data indicate that his opinion is correct? α = 0.05. Using TI graphing calculator to perform the analysis step by step, i.e., if there is no credit for using ANOVA(),
2) (10 pt) Construct a 95% confidence interval for his mean score for Shoulder, and con- struct a 95% confidence interval for the difference between mean scores for Summer and Winter. Interpret both CIs.
Hint: the formulas for CI are on page 15 of STA106Filled OneWayANOVA Part2.pdf
Problem 2 (30 points): An experiment was run to determine whether four specific firing tem- peratures affect the density of a certain type of brick. A completely randomized experiment led to the data (stored in a CSV “BrickDensity.csv”).
1) (20 pt) Does the firing temperature affect the density of the bricks? α = 0.05
After formulating the hypotheses, use R to solve this problem. Please attach (only) the F -score and p-value from R output.
2) (10 pt) Construct a 90% confidence interval for the mean density for temperature 100, and construct a 90% confidence interval for the difference between mean densities between temperature 150 and temperature 175. No interpretations are needed here.
For this question, you have to write your own R code. The formulas are on page 15 of STA106Filled OneWayANOVA Part2.pdf
Please attach your R code for computing the confidence intervals and the results.
Problem 3 (40 points): Write a R function to implement Two-sample t-test (equal vari- ance).
|
The function should have four inputs: ❼ sample1: a vector denotes the first sample. ❼ sample2: a vector denotes the second sample. ❼ test.type: a character takes one of three values "double", "upper", "lower". ❼ alpha: the level of significance. The function should return three values as the output: ❼ tstar: the t-score. ❼ pvalue: the p-value. ❼ result: the decision towards hypothesis testing.
The function should check the sample size nl + n2 > 30 before computing test statistic and p-value. If the condition fails to hold, then return a error message ‘‘Error!’’ .
TwoSampleTTest.EqVar = function(sample1, sample2, test.type, alpha){ ... return( c(tstar, pvalue, result) ) } |
Hint: you can mimic the function TwoSamplePropZTest defined in STA106IntroductionR.R to build this one.
❼ Test your function TwoSampleTTest.EqVar using the samples are randomly generated
from rnorm(). For example,
##Two random samples of sizes 23 and 17 are generated from two normal populations ##1st population has mean 2.7, std error 1.5
##1st population has mean 1.3, std error 1.5
sample1 = rnorm(23, mean=2.7, sd=1.5)
sample2 = rnorm(17, mean=1.3, sd=1.5)
This step is called “testing and debugging”. The calculation of TwoSampleTTest.EqVar can be found in STA106Lec2ABTests.R on Canvas.
❼ There are two cases to be tested:
##Case 1: two samples with equal means
sample1 = rnorm(23, mean=2, sd=1.5)
sample2 = rnorm(17, mean=2, sd=1.5)
##Case 2: two samples with unequal means
sample1 = rnorm(22, mean=3, sd=1.7)
sample2 = rnorm(31, mean=1, sd=1.7)
Attach the code of your R function and test results for test.type="double", test.type="upper" , test.type="lower" respectively. Use alpha=0.05. Simply, apply TwoSampleTTest.EqVar six times (2 cases by three hypotheses).
❼ No partial credit for a semi-finished function, or a non-function solution or a function
with bugs.
This is a real data science program. All statistical/data science/machine learning libraries are made of many functions like this one. Functions can relieve you from boring and repeated tasks.
2022-02-15