BUSM112 Applied Empirical Methods 2017
Hello, dear friend, you can consult us at any time if you have any questions, add WeChat: daixieit
Final in-class-test 2017
BUSM112 Applied Empirical Methods
Question 1.
The table below gives the OLS regression results for a Cobb Douglas production function. The dataset is for the manufacturing sector in the USA, covering 50 states and Washington, D.C. for the year 2005.
lnoutputi=B1+ B2lncapitali+ B3lnlabori
where lnoutput stands for the natural logarithm of output (in thousand of dollars) for state i. lncapital stands for the natural logarithm of capital expenditure (in thousand dollars). lnlabor stands for the natural logarithm of labor (in thousand of workers’ hours). B1 stands for a constant (_cons).
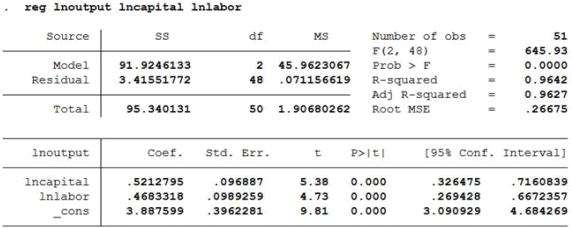
1.a) Which of the explanatory variables (also known as regressors) are statistically significant at the 10% significance level?
1.b) Explain how you would interpret the regression coefficient of lnlabor.
1.c) Explain how you would interpret the R-squared statistic ofthis regression?
1.d) How would you test whether the OLS model presented suffers from multicollinearity given that labour and capital could be correlated? Be explicit as to what values this test would need to take for you to conclude that the regression suffers from multicollinearity.
Question 2.
2.a) Explain what sort ofregression should be used to estimate propensity scores and what variable
should be used as the dependent variable in this regression.
2.b) Explain the different types of matching methods available in the propensity score literature that
can be used to pair participants with non-participants.
Question 3.
A micro-finance programme provided small credit to poor farmers with the goal of increasing their household income. The following table provides the average household income of the participants and non-participants ofthis programme, for the pre- and post-
intervention period.
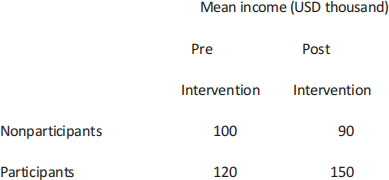
3.a) Using the difference-in-difference method, estimate what is the net impact ofthe micro-finance programme on the farmers’ income. Show clearly the calculations involved and interpret your
results.
3.b) Explain what sort of regression you would need to use to estimate econometrically the difference-
in-difference impact ofthis micro-finance programme.
3.c) Write down the regression equation that you would use to estimate econometrically the difference- in-difference estimator for this micro-finance programme. Explain which regression coefficient
measures the difference-in-difference estimator.
Page 4
Question 4.
4.a) Explain how the instrumental variables method corrects for endogeneity.
4.b) Explain what characteristics a good instrument should have to deal with endogeneity.
4.c) Discuss what sort of tests one needs to perform to empirically assess the validity of the
instruments used.
Question 5.
The following table shows the autocorrelation function between the current exchange rate USA/Euro measured in natural logarithm (lnex) and its lagged values.
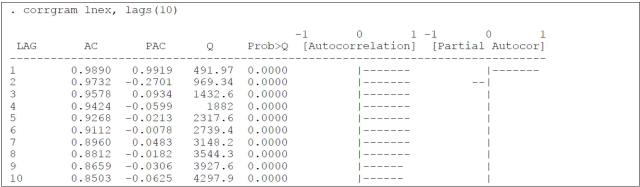
5.a) Based on the autocorrelation function presented, do you conclude that the exchange rate series
is stationary, if so explain why?
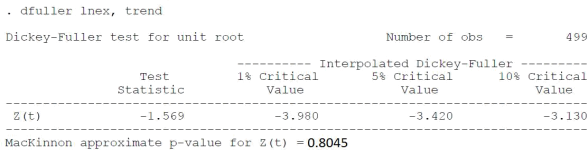
5.b) Below you can find the Augmented Dicky fuller test of the exchange rate series. Based on this
test can you ascertain ifthe series is stationary?
![]()
2022-02-12