ECE 102: Systems and Signals Winter 2022
Hello, dear friend, you can consult us at any time if you have any questions, add WeChat: daixieit
Homework 3
ECE 102: Systems and Signals
Winter 2022
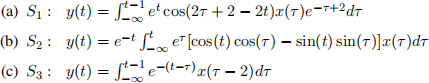
1. Compute the impulse response functions h(t) for each of the LTI systems given below. Comment on the causality and BIBO stability of the systems.
2. Given below are two cascaded LTV systems S1 and S2. The input-output relation for system S1 is given by eqn. (1), where x(t) and y(t) are inputs and output of system S1, respectively. The input-output relation for system S2 is given by eqn. (2), where y(t) and w(t) are inputs and output of system S2 respectively.
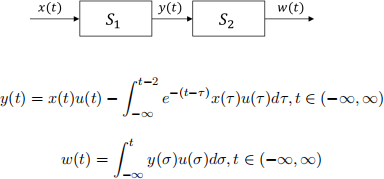
(a) Compute IRF of S1 and S2 : h1(t, τ ) and h2(t, τ ) respectively.
(b) Compute IRF h12(t, τ ) of cascaded system S1S2.
(c) Is the cascaded system (with input x(t) and output w(t) ) a stable system? Explain.
(d) Obtain the IRF h21(t, τ )
3. Matlab assignment 1: Consider signal y(t) = sinc(t), where sinc(t) 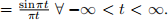 Using Matlab, implement and plot the following signals over the range t ∈ [−5, 5]. Your final submission for this question should consist of six plots and the Matlab code.
(a) y(2t − 1)
(b) y2(t)
(c) z(t) = y(t) ∗ y(t)
(d) Verify by means of Matlab plots whether z(2t − 1) is equal to {y(t) ∗ y(2t − 1)} or {y(2t − 1) ∗ y(2t − 1)} or neither.
4. Matlab assignment 2: For the following problems, include screenshots/images of your MATLAB figures. You should have 5 total figures for this problem. Also, copy and paste your MATLAB code into your homework.
a) Using MATLAB, plot x(t) and h(t) individually over the range t ∈ [−3, 3].

b) Compute y1(t) = x(t) ∗ h(t) (∗ : convolution operator) analytically as a piecewise function.
(c) Solve for y2(t) = x(t) · h(t) (where · is the multiplication operator) analytically.
(d) Using MATLAB, plot y1(t) and y2(t) individually over the range t ∈ [−3, 3]. Are y1(t) and y2(t) the same?
(e) Using MATLAB, numerically convolve x(t) and h(t) and plot the result over the same range. Confirm that the result is the same as y1(t).
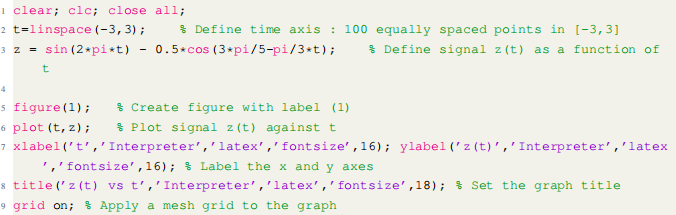
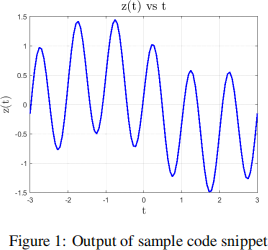
Hint for Matlab assignments: Here is a sample code snippet to help you get started. The following code plots the signal  in the time interval [−3, 3].
Some useful Matlab functions:
(a) heaviside(x) : generates unit step function. eg. u=heaviside(t); generates function u(t)
(b) conv(x,y): returns convolution of input signals/vectors x and y.
(c) Elementwise multiplication of vectors in matlab: x.*y
2022-01-28