MQF 22:839:571, Financial Modeling I, Spring 2022
Hello, dear friend, you can consult us at any time if you have any questions, add WeChat: daixieit
MQF 22:839:571, Financial Modeling I, Spring 2022
Assignment I
This assignment will get you familiarized with the CRSP database and some stylized facts about the U.S. asset markets. I would like you to write primitive matrix codes in Matlab to complete this assignment. In particular, you should compute sample statistics, such as mean, standard deviation, skewness, kurtosis, t-statistic, correlation, etc., by writing matrix codes as opposed to calling built-in functions in Matlab.
Collect monthly returns observations for the CRSP value-weighted market portfolio (for all three markets, i.e., NYSE, Amex and Nasdaq), the 3-month T-bill, and the CPI index for the past twenty years (2001.1-2020.12). I have provided the US housing price index, gold price index and crude oil price index. You will also need to collect returns observations for the CRSP value- weighted market portfolio and the 3-month T-bill for the entire history (1927.1-2020.12). To get the data from CRSP, you need to login to WRDS, https://wrds-web.wharton.upenn.edu/wrds/.
1. Calculate the average monthly return, standard deviation, skewness, and kurtosis for the stock market, the risk free asset, the CPI, the housing market, the gold market and the crude oil market. (Please note that you have to convert the housing, gold and oil prices to their respective returns.)
2. Note that the returns provided by CRSP are discrete returns. Now convert market return from discrete to continuously compounded return (we also call the continuously compounded return log return) and calculate the sample average. Do you see a big difference between the discrete returns and continuously compounded returns?
3. We know that in general investors may be better off by investing in stocks than in T-bills ifthe investment horizon is relatively long. The difference between the market return and the T-bill rate is called the equity risk premium. Using the 20-year data, test whether the equity risk premium is significantly positive using the standard t-test. Also calculate the average real return rate for the T-bill using the CPI index.
4. Many people believe that real estate is always a good investment at least in the long run. Do you agree? People also argue that gold is a safe asset with a good return. Do you agree? Would you make a fortune by investing in the oil market compared to the stock market in the past 20 years (think about return vs. risk)?
5. We often assume that stock returns are normally distributed. Calculate the skewness and kurtosis of market returns. Is the distribution skewed? Does the distribution have excess kurtosis? Use the Jarque-Bera test to see whether the market return follows a normal distribution. Also do the same analysis using daily and annual market returns data.
6. The simple market efficiency hypothesis says that stock price should follow a random walk. One implication of the random walk hypothesis is that returns are serially uncorrelated at any order. Now compute the 1-12 order series correlations for the market return. Do you find any of the correlations to be significantly different from zero?
7. Assume that the stock market has an annual mean return of 10% with a standard deviation of 20%, and that the annual risk-free rate is 4%. Assume that the annual market return follows a normal distribution. Most investment advisors suggest that you should invest in the stock market (as opposed to the bond or money market) if your investment horizon is relatively long because stock return is higher with low risk. Assume that you start with an initial wealth of $1 million and invest your money in the stock market for 5 years. Simulate your terminal wealth (after 5 years) under the assumption that the stock return follows the normal distribution. Repeat this experiment for 10,000 times. How many times do you lose money (i.e., your terminal wealth is less than $1 million)? How many times is your investment in stock market worse than in T-bill (assuming the risk-free rate has zero standard deviation)? Now do the same analysis under the assumption that the stock return follows a t(3) distribution with the same standard deviation of 20%. Do you think the advice from popular investment advisors makes sense?
8. Stock return may not follow a normal distribution. Indeed, outliers and fat tails can affect your investment in a significant way. Now we abandon the normality assumption. We can simulate stock returns by randomly drawing observations from the historical data, one observation at a time with replacement. This is called bootstrapping. Now redo the analysis in 7 by simulating your terminal wealth using bootstrapping. How do your results change?
Note:
The Jarque-Bera test statistic for normality can be calculated as follows:
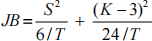
where
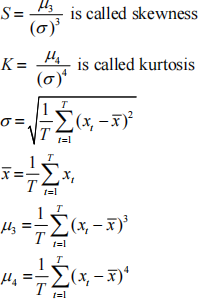
T is the sample size and x is the returns data.
Under the null hypothesis that returns are normally distributed, we have
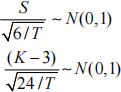
Furthermore, S and K are independent and therefore

2022-01-27