Coursework for 661985 – Safety Critical Systems
Hello, dear friend, you can consult us at any time if you have any questions, add WeChat: daixieit
Portfolio for Safety-Directed Design of a Brake-By-Wire System for Car
Coursework for 661985 – Safety Critical Systems
The Portfolio explores the iterative design of a Brake-By-Wire (BBW) system for cars.
There are two parts to this assignment. Part 1 is worth 40% of the assignment and Part 2 is worth 60% of the assignment.
You will analyse this architecture using Fault Tree Analysis and Markov Models and you will be asked to reflect on results. The tasks involve logical analysis and a small component of programming.
The proposed architecture for the system is given in Figure 1 below:
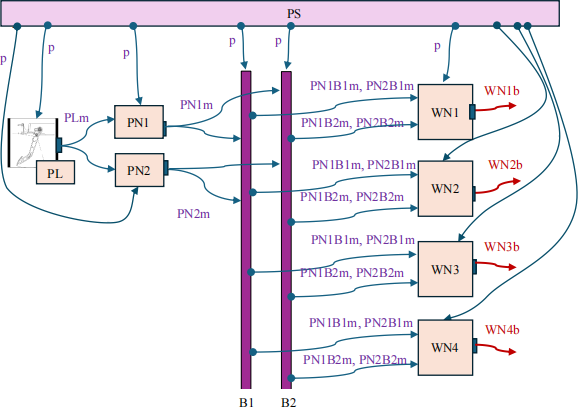
Figure 1. The proposed architecture of the BBW system
System Specification
• The BBW features separate braking on each wheel.
• All components of the system are powered by a common power supply (PS).
• An electromechanical pedal (PL) receives the braking demand from the driver and sends this as message (PLm) to two pedal nodes PN1, PN2.
• Two replicas ofthe message are sent by each pedal node to busses B1 and B2. PN1 sends PN1m, while PN2 sends PN2m.
• Four Wheel nodes (WN1 … WN4) each read those four identical messages (PN1B1m, PN2B1m, PN1B2m, PN2B2m) from the two busses.
• As long as one of the messages is received a wheel node can create the braking output applied to the corresponding wheel (WN1b ... WN4b).
Failures
Each component in this system has only one failure mode that shares the name of the component. For example:
• The failure mode of component PS is PS
• The failure mode of component B1 is B1
The failure mode of each component leads to omission of all outputs. For example:
• If PS fails, you get O-p (Omission of p)
• If B1 fails, you get O-PN1B1m and O-PN2B1m
In the absence of component failures, all four wheels apply the braking output and the car brakes correctly.
When components fail, the system may fail to brake on one or more wheels. The effects vary depending on the number of wheel failures. For example:
• If one wheel fails, the car brakes sufficiently but is likely to skid off its course.
In this case, to correct the skidding failure, an electronic stability program could release the wheel that is diagonal to the wheel that fails to brake. The car then brakes slowly, and the stopping distance is increased.
• If all wheels fail, then the car experiences catastrophic loss of braking.
Part 1 - Safety Analysis and Iteration of Design
Part 1 is worth 40% of the Portfolio mark.
Based on the design given for the BBW in Figure 1 and its specification:
1. Draw, or alternatively specify clearly using a set of logical expressions, a fault tree for the event “Omission of braking output by WN1”, i.e. for the event O-WN1b (10 marks).
2. Calculate the minimal cut-sets of the fault tree (10 marks)
3. Identify components that are single point of failure (2 marks)
4. Based on the cut-sets, propose improvements to the system (3 marks)
5. Draw, or alternatively specify clearly using a set of logical expressions, a fault tree for the
“complete catastrophic loss of braking in all wheels”. Name the top event “O-all” (10 marks)
6. Calculate the minimal cut-sets for this tree (5 marks)
Notes:
• Explain your solutions in [1-6] above with a short paragraph of text to show your understanding. Avoid verbosity. Up to 30% of marks will be deducted for lack of explanation.
• Fault trees should be constructed systematically by traversing the model of the system architecture and applying the algorithm taught in the course. Unsystematic, simplified, fault trees that somehow capture the failure logic correctly will be awarded less marks. If the calculation of cut- sets that follows from such simplified fault trees is trivial, it will be awarded less marks.
• For clarity, in your fault trees, use the names of components, messages and component failure modes as displayed in Figure 1. Marks will be deducted if you use names that don’t correspond to the figure.
• To avoid repetition of branches, expand the branch that is repeated only once and use references to the top event of this branch elsewhere. Marks will be deducted if you unnecessarily expand repeated branches.
• You may use HiP-HOPS or any other tool available free on the internet to construct the fault tree or calculate cutsets. However, make sure that you answer the questions. Fault trees must be drawn as graphs using the guidelines given above. Calculations of cutsets must be explicit, contain all logical steps, and explained. Tools will not necessarily do these things for you.
• Graphs should be produced electronically in a fault tree analysis or drawing tool such as draw.io. Any symbols or text must be clearly readable.
Part 2 –Dynamic Reliability Analysis of the BBW
Part 2 is worth 60% of the Portfolio mark.
Based on the design given for the BBW in Figure 1 and its specification, you will analyse the architecture using Markov Models. Calculation of reliability involves some coding. Note that the system description, failure modes, and behaviours in conditions of failure (e.g. Skidding) remain exactly as described earlier in the specification of the system.
Further assumptions that underpin reliability analysis are as follows:
• It is assumed that all components have two states Operational and Failed.
• It is assumed that the system is completely healthy at the starting point.
• The failure distribution of all components is exponential with a constant failure rate.
Based on this design and the assumptions solve the following tasks:
7. Only consider the independent failure modes ofthe 4 Wheels in the BBW, and assume that the rest of the system is perfect. Each single wheel failure leads the BBW to hazardous states of asymmetrical braking. In each of the 4 cases, skidding prevention is applied by locking the diagonal wheel leading the system to a corresponding recovery state with reduced braking capacity. We assume that the skidding prevention mechanism is perfect, i.e. the probability of its failure is zero. We also assume that any further wheel failure from asymmetrical braking or recovery states will lead the BBW to a single terminally failed state.
Draw a Markov model and explain the model construction procedure. Consider that all wheels have the same failure rate of 0.0054 failures per hour. Provide a Python code to calculate and visualise the reliability curve for 1850 hours (20 marks).
8. Only consider the failure modes of PL, PN1, PN2, B1, B2, and PS, assuming that the wheels are perfect.
Draw a Markov model that shows how the system moves into a state of complete loss of braking and explain the model construction procedure. Consider that all failure modes have the same failure rate of 0.000623 failure/hours. Provide a Python code to calculate and visualise the reliability curve for 2000 hours. (20 marks).
9. Consider only failure modes of B1 and B2, and then assume that all other components are perfect. Also, assume that the busses are repairable with a failure rate of 0.0002 failures per hour, and a repair rate of 0.01 repairs per hour.
Construct a Markov model to evaluate the Availability and MTBF of the bus subsystem of the two busses. Provide a Python code for steady-state availability and MTBF calculation (10 marks).
10. Consider only the failure modes of PN1, PN2 and PN3. Assume that all other components are perfect. Only focus on the reliability of pedal nodes and explain how it can be improved using a reconfigurable Triple Modular Redundancy (TMR) architecture with two hot standby redundancy (see Figure 2). Apply the fixed failure rate of 0.000872 failures per hour to all components.
Construct a Markov model to evaluate the reliability of the Pedal Node subsystem consisting of the three PN nodes with the new architecture. Provide a Python code for reliability calculation and visualise the reliability curve for 4710 hours. The coverage factor should be 0.85 (10 marks).
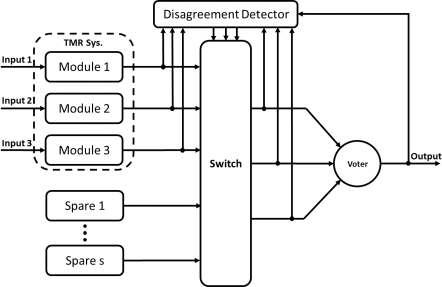
Figure 2, Reconfigurable TMR with Hot Standby Spares
Notes:
• Explain your solutions in [7-10] above with a short paragraph of text to show your understanding. Avoid verbosity. Up to 30% of marks will be deducted for lack of explanation.
• For computational problems in [7-10], please place your Python solutions into a single Jupyter notebook. Clearly label each question within the notebook (e.g., Question_7 to Question_ 10). Export this notebook as a PDF and attach it to your final submission. Ensure the notebook is well-structured, executable, and clearly documented to facilitate assessment.
• Ensure your code is runnable. If your code cannot be executed due to errors, it will be examined manually, and marks will be awarded based on the effort and correctness of the approach.
2026-03-03
Portfolio for Safety-Directed Design of a Brake-By-Wire System for Car