Asset Pricing II: Second (Individual) Assignment Predictability
Hello, dear friend, you can consult us at any time if you have any questions, add WeChat: daixieit
Asset Pricing II: Second (Individual) Assignment Predictability
Please enclose your computer code with your solutions.
(The code itself is not marked but should be enclosed as it is student’s opportunity to demonstrate the individual effort.)
Data: All data for this assignment is contained in the spreadsheet "Assignment2Data_2026.xlsx" which is available on the course website.
Spreadsheet Q1 contains the data relevant for this part of the assignment. The dataset in-cludes annual total returns (R) on the NYSE/Nasdaq/AMEX value-weighted index of all listed shares, growth in aggregate dividends on these shares (DG), aggregate dividend yield on this portfolio (DP), and the Payout Ratio (DE) all adjusted for changes in the CPI, start-ing in 1927 and ending in 2025.
Conduct your analysis using variables adjusted for changes in the CPI. (Round your results to three decimal places.)
Assignment
1. Report in a table the mean and standard deviation of total returns and of net dividend growth for the periods 1927-2025 and the more recent period 1973-2025, together with the correlations of returns and dividend growth over these periods. (Results reported in a table are enough, comments are not necessary.) [15 points]
2. Does the dividend yield predict equity index annual total returns in the periods 1927-2025 and the more recent period 1973-2025? Answer by reporting coefficients, t-statistics and adjusted-R2s for these two periods for the regression
Rt+1 = a+b(Dt/Pt) +εt+1. (1)
(Results reported in a table are enough, comments are not necessary.) [15 points]
3. Does the dividend yield predict annual real dividend growth in the periods 1927-2025 and the more recent period 1973-2025? Answer by reporting coefficients, t-statistics and adjusted-R2s for these two periods for the regression
(Dt+1 −Dt)/Dt = a+b(Dt/Pt) +εt+1. (2)
(Results reported in a table are enough, comments are not necessary.) [15 points]
4. Does payout ratio in your data predict dividend growth in these periods?
(Report results in a table and comment in one-two sentences.) [15 points]
5. Campbell and Shiller (1988) propose an approximation for log total returns around the mean of the log dividend yield:
 (3)
(3)
and they also show that this approximation is very accurate for observed values of volatility of the dividend yield. Here lower case letters denote logs and ∆dt+1 is log gross dividend growth ln(Dt+1/Dt). ρ = (1+e E[d−p])−1 and in annual data is about 0.94 (use this value for your calculations).
Rearranging this gives
pt −dt ≈ k +∆dt+1 −rt+1 +ρ(pt+1 −dt+1). (4)
Then Cochrane (2005) shows
Var[pt −dt ] ≈ Cov[pt −dt ,∆dt+1]−Cov[pt −dt ,rt+1] +Cov[pt −dt ,ρ(pt+1 −dt+1)]
and dividing by the left-hand side gives
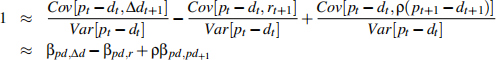 (5)
(5)
where the quantities βpd, j are the OLS coefficients of a forecasting regression of j (∆dt+1, rt+1, (pt+1 −dt+1)) on pt −dt .
Since equation (3) comes from an (approximate) accounting identity, Cochrane argues that the correct null hypothesis is not that pt −dt does not predict returns, but that if it does not predict returns it therefore predicts a combination of dividend growth and itself, discounted at the constant rate ρ. I want you to test the hypothesis of return predictibility against the correct null using a restricted VAR.
Estimate the following system of seemingly unrelated regressions
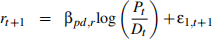 (6)
(6)
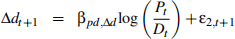 (7)
(7)
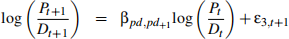 (8)
(8)
where
εt+1 ∼ N(0,Σ)
and Σ is the covariance matrix of residuals ε.
Estimate the coefficients βpd,∆d and βpd,pd+1
equation by equation (don’t forget to include intercept in your regressions), and then construct the estimates for the first equation by forcing 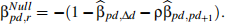 You can estimate the intercept under this cor-rect null by calculating the mean of
 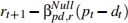 .) Report your results in a table. In 1-2 lines, explain why your answer matters (be concise but precise). [20 points]
6. Now let Xt = [rt ∆dt pt −dt]′, and estimate the following VAR:
Xt+1 = a3×1 +ΓXt +ut+1
ut+1 ∼ N(0,Ω)
Use your estimate of the transition matrix Γ to carry out a variance decomposition of stock market returns. Report the share of stock market return variance between 1927 and 2025 due to news about future cash-flows, news about future returns and covariance between the two. What is the correlation between cash-flow news and discount-rate news?
Briefly comment on the economic meaning of the observed correlation between the cash-flow news and the discount-rate news. [20 points]
[BONUS QUESTION]
Predictability of announcement and non-announcement days’ returns.
Spreadsheet BonusQuestion contains the data relevant for this part of the assignment. The data for this question are quarterly log returns on the NYSE/Nasdaq/AMEX value-weighted index of all listed shares, quarterly cumulative returns accrued on announcement and non-announcement days for that index, aggregate quarterly dividend yield on this portfolio and an average number of announcement and non-announcement days in each quarter.
Let RAd and RNd′ stand for the daily gross return on a scheduled announcement day d and non-announcement day d′, respectively. I define the cumulative return accrued on scheduled announcement days and non-announcement days in quarter t +1 as a sum of the relevant daily log returns:
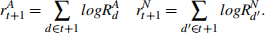
Thus, the total return in quarter t +1 can be expressed as 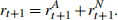 These are the returns provided in the spreadsheet.
Using the sample period between 01/01/1960 - 31/12/2016 estimate the following relation-ships:
 (9)
(9)
 (10)
(10)
 (11)
(11)
For each of the models report in a table the values of the estimated coefficients, their t-statistics, model’s adjusted R 2 , and the average of the dependent variable. Finally, compute the average daily return for each of the three specifications (There might be slightly differ-ent ways of calculating average daily returns given the data. Small differences are tolerated if overall calculation is meaningful). Shortly comment on your results. [5 points]
References
• Campbell, John Y., and Robert J. Shiller. “The dividend-price ratio and expectations of future dividends and discount factors.” Review of financial studies 1, no. 3 (1988): 195-228.
• Cochrane, John H. "The dog that did not bark: A defense of return predictability." Review of Financial Studies 21, no. 4 (2008): 1533-1575.
2026-02-24