PPHA 311 Problem Set 1 Winter 2026
Hello, dear friend, you can consult us at any time if you have any questions, add WeChat: daixieit
PPHA 311
Problem Set 1
Winter 2026
Due date: Friday, January 16, 2026 at 10:00PM. You must submit via Gradescope on Canvas. No late problem sets will be accepted.
Group work: You may work in groups, but each person must submit individual answers. These answers must reflect the individual’s own work and may not be copied from others or generative AI. Please write the names of all members of your study group at the top of your submission.
Scratch work and code: Please show your work (where relevant) and include all code and output for this assignment with your submission. Please use brief but clear comments in the code to reference the applicable assignment section. Note: submitting the code and output of a classmate is considered a violation of our academic integrity policy and will result in a 0 on the overall assignment.
Please post any clarifying questions you have to Ed Discussion. We will do our best to answer all your questions posted on Ed Discussion 24 hours before the assignment deadline.
1 The Oregon Health Insurance Experiment (OHIE) (15 points)
The Oregon Health Insurance Experiment was a randomized experiment run in the 2008 that expanded Medicaid to low-income, uninsured, able-bodied adults aged 19-64 in Oregon through a random lottery drawing. Eligible individuals interested in receiving Medicaid signed up for a lottery; winning the lottery (“treated”) provided an opportunity for the individual and up to two additional eligible household members to sign up for Medicaid. 12,229 individuals participated in a long-term study examining outcomes 2 years later.
In this question, you will work with data from the OHIE Experiment. You should use R to answer this question and append your code and output (or Rmarkdown output) as PDF to your submission. Failure to submit code and output will result in a 0 on this question.
Refer to the datafile OHIE.csv available on Canvas→ Modules→ Problem Set 1. This file con- tains 12,229 rows, where each row is a survey response from a person in the experiment. The dataset on Canvas has the following variables:
|
Variable |
Description |
|
person |
id |
Unique anonymous person identifier |
||
|
treated |
1=won lottery to apply for Medicaid |
|||
|
numhh |
Number of eligible household members |
|||
|
female |
1=female sex, 0=male sex |
|||
|
age |
Age in years |
|||
|
race white |
1=self-reported race non-Hispanic White, 0=all others |
|||
|
hs_degree
|
1=HS diploma or GED, 0=all others |
|||
|
college degree |
1=college degree, 0=all others |
|||
|
health baseline |
1=Diagnosis of any major health condition, pre-lottery |
|||
|
ever |
medicaid |
Ever Enrolled in Medicaid coverage since lottery |
||
|
visit dr |
Number of doctor office visits since lottery |
|||
|
visit |
er |
Number of emergency room visits since lottery |
||
|
out of pocket spend |
Amount of out-of-pocket spending ($) since lottery |
|||
|
health score |
“Framingham risk score”* – summary measure of current health status at endline |
|||
|
happy |
1=reported happy or pretty happy at endline |
|||
* Note: The Framingham risk score is a function of age, total cholesterol and HDL cholesterol levels, measured blood pressure and use or nonuse of medication for high blood pressure, current smoking status, and blood sugar levels.
Please note that some outcomes have “NA” values if respondent data were unavail- able. When analyzing an outcome with an “NA” value, simply exclude those rows from your analysis for that particular outcome. This also means that the sample sizes will be smaller for outcomes with “NA” values.
1. Fill in the following balance table. In Column (4), calculate the p-value using a two-sample t-test assuming equal variance. Recall, the test-statistic for this test is given by:
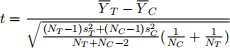
where t is distributed as Student’s t with NT + NC − 2 degrees of freedom. In terms of notation, YT is the sample mean of the treated group, YC is the sample mean of the control group, NT is the sample size of the treated group, NC is the sample size of the control group, s 2 T is the sample variance of the treated group, s 2 C is the sample variance of the control group.
You can code the t-test up manually yourself or use R’s t.test() command with the option var.equal=TRUE. (3 points)
|
|
(1) |
(2) |
(3) |
(4) |
|
Baseline characteristic |
Control Mean |
Treated Mean |
Diference (2)-(1) |
p-value |
|
numhh |
|
|
|
|
|
|
female |
|
|
|
|
|
|
age |
|
|
|
|
|
|
race white |
|
|
|
|
|
|
h |
s degree |
|
|
|
|
|
college degree |
|
|
|
|
|
|
health baseline |
|
|
|
|
|
2. Discuss your findings. Do these baseline characteristics appear balanced? (2 points)
3. Calculate the treatment efect of winning the Medicaid lottery and the statistical significance for each of the outcomes, filling out the table below. Discuss your findings–– What conclusions can we draw about the efectiveness of the Medicaid lottery program? (3 points)
|
|
(1) |
(2) |
(3) |
(4) |
|
Endline characteristic |
Control Mean |
Treated Mean |
Diference (2)-(1) |
p-value |
|
visit |
dr |
|
|
|
|
|||
|
visit er |
|
|
|
|
||||
|
out |
of |
|
spend |
|
|
|
|
|
|
health score |
|
|
|
|
||||
|
happy |
|
|
|
|
||||
4. Let’s try redoing Part (3) using a simple linear regression.
For each of the outcomes in Part (3) above, run a simple linear regression of the outcome on a treatment indicator:
Yi = β0 + β1Treatedi + ui
Compare to your results in Part (3) above.
For this question, we recommend using the lm() regression function in R and referring to the output in your answer. (3 points)
5. In what ways might features of this experiment afect the external validity of the results, say, to thinking about expanding Medicaid to the entire U.S. population of low-income, able- bodied adults?(2 pt)
6. Suppose instead of running an experiment, you could get health data on everyone in the low- income, able-bodied adult population in 2008. You compare the health outcomes of those with health insurance to those without health insurance. Do you expect you will find similar results to Part (3)? Why or not? (2 pts)
2026-01-15