Applied Econometrics and Policy Analysis
Hello, dear friend, you can consult us at any time if you have any questions, add WeChat: daixieit
Coursework
Applied Econometrics and Policy Analysis
This document contains the task of the coursework. You need to create a separate docu- ment with the report, containing your answers to the questions below. Maximum length of report is 5 pages, including figures and tables. Extra pages will not be read. Stick to the word limit where specified, longer answers will receive a mark of zero. Be precise in your writing: vague and generic statements will be downgraded.
1 Estimating Causal Effects [70 Marks]
You are interested in estimating a causal effect of a training program called Job Corps: https://en.wikipedia.org/wiki/Job_Corps. The Job Corps is the largest U.S. labour market program targeting disadvantaged youths. It provides academic, vocational, and social training, as well as health care counselling and job search assistance, for an average duration of eight to nine months.
The dataset for this exercise is uploaded on canvas. Load the data job_corps_sample.csv which contains a subsample of the individuals who participated in the program. The dataset contains the following variables:
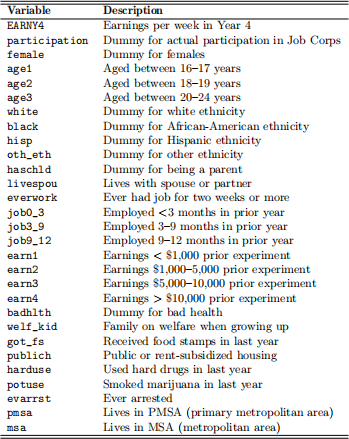
Table 1: Variable definitions for Job Corps evaluation data
1. First, examine the data by reporting the following descriptive statistics:
|
Share of the sample, who participated in the program (in %) |
|
|
Share of females in the sample (in %) |
|
|
Number of people who smoked marijuana in last year |
|
|
Number of people who live with spouse or partner and are parents |
|
2. We want to estimate the causal effect of participation in Job Corps on the weekly earnings of participants four years after the program. For this purpose, we estimate the univariate linear regression model,
EARNY4 = γ + δ · participation + u. (1.1)
a) What is the main assumption we have to make to interpret δ in a causal way? Write maximum 100 words. 2 MARKS
b) How credible is the identifying assumption in this application? Write maxi –mum 100 words. 3 MARKS
3. In order to make the identification assumption more plausible, we can select the control variables X using economic theory, or intuition. For example, Job Corp participants usually live on a campus during the program participation. Accordingly, parents might have a lower participation probability, because it is difficult to live together with a child on the campus. Furthermore, the effect of having a child (haschld) on the participation probability might might be differential for mothers and fathers. Accordingly, the interaction between gender and children (haschld*female) might be relevant as well. Estimate the following multivariate model:
EARNY4 = γ + δ · participation + β1haschld + β2haschld * female + u. (1.2)
What is the main assumption we have to make to interpret δ in a causal way? How credible is the identifying assumption in this model? Write maximum 100 words. 6 MARKS
4. Compare the difference in the observable characteristics between the groups of par- ticipants and non-participants. Characteristics which differ greatly between the two groups appear to be important control variables.
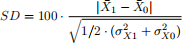
The standardized differences (SD) are defined as
 (1.3)
(1.3)
where X1 and X0 are the means and σX1 and σX0 the standard deviations in the groups of participants and non-participants, respectively. Large standardized dif- ferences indicate a large inbalance between the characteristics of participants and non-participants.
Report standardised differences defined in eq. (1.3) for livespou, publich, evarrst, badhlth, job9_12. Interpret the numbers briefly. Report the numbers with 3 digits after the decimal point in the format of a table given below:
|
SD |
Brief interpretation (≤ 20 words) |
|
|
livespou |
|
|
|
publich |
|
|
|
evarrst |
|
|
|
badhlth |
|
|
|
job9_12 |
|
|
10 MARKS
5. Now we estimate the multivariate linear regression model,
EARNY4 = γ + δ · participation + β · X + u. (1.4)
where X consists of the following control variables livespou, publich, evarrst, badhlth, job9_12.
Estimate Models 1 - 3 defined in equations (1.1), (1.2), (1.4) respectively. For each model in the format of the table given below report 1) estimated effect of participation
in Job Corps on earnings δ(ˆ) 2) 95% confidence interval for the estimated effect of
participation in Job Corps on earnings 3) p-value which corresponds to testing the one-sided hypotheses pair H0 : δ ≤ 0 vs. Ha : δ > 0. Report the numbers with 3 digits after the decimal point.
|
|
Model 1 |
Model 2 |
Model 3 |
|
1) δ(ˆ) |
|
|
|
|
2) 95% CI |
|
|
|
|
3) p-value |
|
|
|
15 MARKS
6. Using the logit model estimate propensity scores for all individuals in the sample. For
controls use haschld * female, haschld, livespou, publich, evarrst, badhlth, job9_12. Plot two histograms of propensity scores for treatment and control groups separately and discuss whether the overlap assumption holds. Write maximum 100 words. 10 MARKS
7. Estimate the Average Treatment Effect (ATE) and the Average Treatment Effect on the Treated (ATET) using the IPW type I estimator with the propensity scores
from the previous step. Report your results with 3 digits after the decimal point.
Explain why do the ATE and ATET estimates differ from each other and from the OLS estimates. Write maximum 200 words. 20 MARKS
2 Short Answers [30 Marks]
Each answer should be maximum 150 words.
1. Suppose we estimate the effect of military service on earnings using draft lottery number as an instrument. What population does the IV estimator identify, and under which assumptions? 10 MARKS
2. Explain the difference between AIC and BIC as model selection criteria. Which would you prefer in small samples, and why? 10 MARKS
3. Why might forecasts from a simple AR(1) model sometimes outperform those from a higher-order ARMA model, even if the latter has a better in-sample fit? 10 MARKS
2025-12-26