Soc. 2010 (Fall 2025) - Assignment 4
Hello, dear friend, you can consult us at any time if you have any questions, add WeChat: daixieit
Soc. 2010 (Fall 2025) - Assignment 4
Note: Stata work in this assignment makes use of “gss2012.dta”. Always remember to inspect your data and measures first. When asked to interpret, you do not need to write everything that comes to mind. Instead, try to summarize the findings concisely and meaningfully. Paste all output and syntax.
** This assignment will not be peer graded; however, we will discuss the solutions during lecture and/or TA Stata Labs **
1. Suppose that you regress children’s reading achievement scores on the number of books in
the household and obtain the following estimates:  = 70 and
  = 0.60.
a. Interpret the intercept,  .
.
b. Interpret the slope,  .
.
c. Re-interpret the slope for an increase of 10 books.
2. Suppose a colleague sends you a data set that contains two variables, a measure of mental health and a measure of marital satisfaction. How would you determine which variable should be the dependent variable and which the independent variable?
3. Suppose that you estimate a multiple regression model using the following variables:
depress Depression scale (ranging from 0 to 105)
reduc Respondent's education level (ranging from 0 to 20)
rearninc Respondent's annual earned income (ranging from $1 to $800,000)
hrwork Respondent's hours spent at paid work/week (ranging from 1 to 95)
numkid Number of persons <=18 in the household (ranging from 0 to 10)
And obtain the following results:
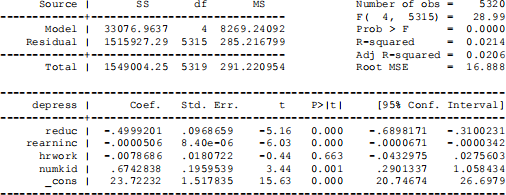
a) Verify the value of R-squared with a hand calculation.
b) Interpret the R-squared value.
c) Can we reject the null hypothesis and conclude that at least one of the slopes for one of the four predictor variables differs from zero? Why? Show how you can calculate this using information from the table.
d) Interpret the intercept. As you do so, comment on whether the intercept is meaningful for this regression model.
e) Interpret the point estimate for reduc using units of 4.
f) Verify the confidence interval bounds for numkid with a hand calculation and write a one sentence interpretation of the interval.
4. How are TSS=total sum of squares, MSS=model sum of squares, and SSE=sum of squared errors mathematically related?
5. Suppose that the unadjusted R-squared value from a regression of wages (WAGE) on years of work experience (EXPER) is 0.25.
a. Interpret this R-squared value.
b. What is the Pearson correlation (r) between WAGE and EXPER?
6. Suppose that you know that the Pearson correlation coefficient between two variables is 0.70. What percentage of variation do these two variables share?
7. When we analyze data for the census tracts in the greater Los Angeles area, we find no significant correlation between median tax bill and median lot size. Yet a considerable positive correlation occurs when we control for the percentage of the tract used for business. Explain how the percentage of the tract used for businesses could be a suppressor variable, if it is positively correlated with median tax bill and negatively correlated with median lot size.
8. For the 2014 GSS, the following table shows estimates (with se values in parentheses) for four regression models for y = political party identification in the United States, scored from 1 = strong Democrat to 7 = strong Republican. The explanatory variables are number of years of education in model 1, also annual income last year (12 ordered categories, scored 1 to 12) in model 2, also religion (1 = fundamentalist, 2 = moderate, 3 =liberal) in model 3, and also political views (scored from 1 = extremely liberal to 7 = extremely conservative) in model.
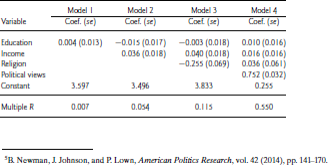
a) Summarize what you learn from these four model fits.
b) The effect of religion weakens considerably (and even changes direction) after adding
political views to the model. Is it plausible that the relationship between y and religion is spurious? Explain.
9. Recent UN data from several nations ony = crude birth rate (number of births per 1000 population size), x1 = women’s economic activity (female labor force as percentage of male), and x2 = GNP (per capita, in thousands of dollars) has prediction equation ^(y) = 34.53 — . 13x1 — 0.64x2. The bivariate prediction equation with x1 is ^(y) = 37.65 — 0.31x1. The correlations are ryx1 = —0.58 , ryx1 = —0.72, and rx1x2 = 0.58. Explain why the coefficient of x1 in the bivariate equation is quite different from that in the multiple predictor equation.
The following questions use the gss2012_subset file (in Canvas):
10. Perform a multiple linear regression model of respondent’s income in constant dollars (realrinc) on education, mother’s education, and gender. Paste your syntax and output.
Substantively interpret the unstandardized partial coefficients and statistical significance.
11. Now, we'll run the same model that we just performed except that we’ll now treat mother's education as a categorical variable rather than one measured in number of years of education.
Construct a binary variable coded 1 if the respondent's mother received a BA degree or higher and coded as 0 if otherwise. Run the regression and paste your syntax and output. Substantively interpret the partial coefficient for mother's degree (including statistical significance).
12. Now, let's construct a 4-category measure for mother's education; this one categorizes by highest degree. Copy/paste your syntax and output. Report and interpret the partial coefficients for mother's education. What is the reference category?
Advanced (optional):
Imagine you are preparing an article for an academic journal.
• Choose a dataset from Canvas or find another file.
• State your research question.
• Choose 4-5 variables that you will analyze to answer your question. Clean the file, as necessary. Save as a new analysis file.
• Describe your data, measures, and analytic sample.
• Produce a journal ready table of summary statistics for the variables used.
• Perform one descriptive analysis. Present the findings in a table or figure. Briefly interpret.
• Perform 2-3 regression models that build on one another. Present the results in a single table. Interpret your results.
• Any notes of caution in the interpretation?
• Make sure to attach your do file and a clean analysis file (only the variables you used) along with your writeup and outputs.
2025-12-06