ECON212 ECONOMETRICS 1
Hello, dear friend, you can consult us at any time if you have any questions, add WeChat: daixieit
ECON212
ECONOMETRICS 1
Question 1.
Consider the following model

with ui ∼ N ![]() 0, σ2
0, σ2![]() , xi being fixed in repeated samples, and Cov
, xi being fixed in repeated samples, and Cov ![]() ui, uj
ui, uj ![]() = 0 for i
= 0 for i ![]() j. You have a random sample of yi (with i = 1, ..., n) available for the estimation of the parameters. You first use the following estimator
j. You have a random sample of yi (with i = 1, ..., n) available for the estimation of the parameters. You first use the following estimator
Justify your answers to the questions below demonstrating all relevant derivations and the assumptions you use.
(a) Is ![]() 1 an unbiased estimator of β1?
1 an unbiased estimator of β1?
(b) Derive the variance of ![]() 1
1
(c) Consider an alternative estimator ![]() 1 for β1
1 for β1
Is ![]() 1 an unbiased estimator of β1?
1 an unbiased estimator of β1?
Question 2.
A researcher is given a data set of 100 households which includes information about their annual consumption in $ (cons) and their annual income in $ (inc). The researcher fits the following model

and the relevant Stata output is presented in Figure 1. Note that, in the output, ln(cons) = ln cons and ln(inc) = ln inc.
(a) What is the interpretation of parameter β1?
Figure 1: OLS estimation output of Equation (2).
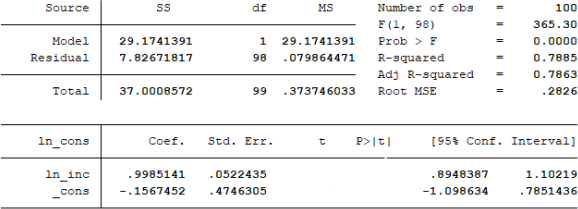
(b) How would the estimate of parameter β1 change if we would re-estimate
Model (2) measuring the weekly income in terms of cents ($1=100 cents)?
(c) Note that the sample mean of ln (cons) is 8.898634. What is the sample mean of the regressor ln (inc)?
(d) Calculate the p-value corresponding to the test of significance of the intercept term: H0 : β0 = 0 against H1 : β0 ![]() 0. Does this p-value support, or not, the significance of the intercept?
0. Does this p-value support, or not, the significance of the intercept?
(e) Calculate the p-value corresponding to the null hypothesis H0 : β1 = 1
against H1 : β1 < 1. How do you interpret the p-value you find?
Question 3.
We consider a simple model to explain the labour demand of Belgian firms. To this end, we have a cross-sectional data set of 569 firms that includes information for year 1996 on the total number of employees, their average wage, the amount of capital and a measure of output. The variables as defined as:
L: logarithm of total employment (number of workers);
K : logarithm of total fixed assets (in million euro);
W: logarithm of total wage costs divided by number of workers (in 1000 euro); Y: logarithm of value added (in million euro).
The following model is estimated

and the results are presented in the first column (named as Eq01) of Table 1. The subsequent columns provide the estimation of alternative models (e.g. Eq02 corresponds to the estimation of model Li = α0 + α1 (Ki − Wi)), some of which you may find useful for answering the parts of this Question. Values in (.) provide the standard error of the corresponding estimate and rss refers to the Residual Sum of Squares of each estimated equation.
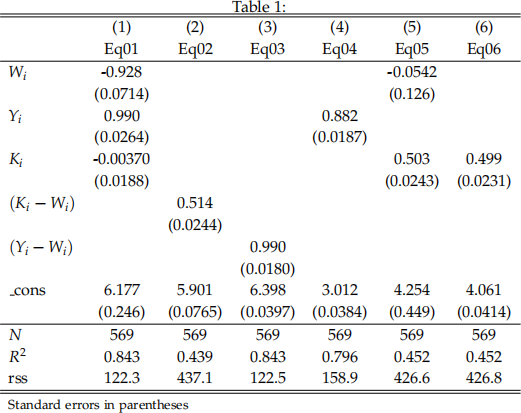
(a) In the context of Model (3), calculate the 95% confidence interval for
parameter β3. Is this interval informative about the significance of the corresponding variable (Ki)?
(b) Test the hypothesis H0 : β1 = β2 = β3 = 0, using a 5% significance level in the
context of Model (3).
(c) In the context of Model (3) test the joint hypothesis H0 : β1 = β3 = 0, using a 5% significance level.
(d) In the context of Model (3) test the joint hypothesis H0 : β1 = −β2 and β3 = 0, using a 5% significance level.
Question 4.
You have a data set containing information on chief executive officers (CEOs) for U.S. corporations. The variable salary is annual compensation, in thousands of dollars, mktval is the company’s market value in millions of dollars, sales is the firm’s sales in millions of dollars and ceoten is prior number of years as company
CEO. You first estimate the model

and the OLS estimation output is given in Figure 2. The variance-covariance matrix of the OLS estimates for Model (4) is provided in Figure 3.
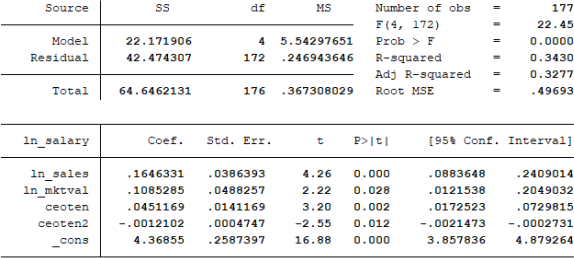
You then estimate the model

with the corresponding OLS estimation output being given in Figure 4. Note that ceoten2 is reported as ceoten2 in the output.
Figure 2: OLS estimation output of Model (4).
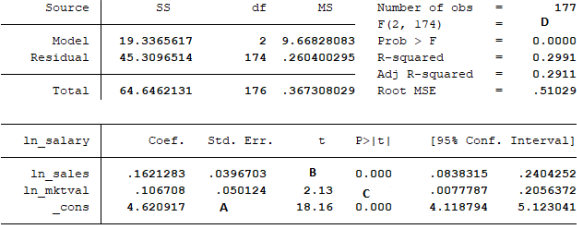
Figure 3: Covariance matrix for the OLS estimates of Model (4).

Figure 4: OLS estimation output of Model (5).
(a) What is the interpretation of parameters θ1 and θ2 in the context of Model (4)?
(b) Evaluate the missing values A, B, C, & D in Figure 2.
(c) Based on the available evidence, is there a possibility for the multicollinearity problem to occur in Model (5)?
(d) Explain what is the effect of the prior number of years as company CEO on the CEO’s salary in the context of Model (5). Using the available evidence, run a test for the significance of this effect at the 5% significance level.
(e) In the context of Model (4), test the hypothesis H0 : θ1 + θ2 = 0.25 vs.
H1 : θ1 + θ2 ![]() 0.25 at the 1% significance level.
0.25 at the 1% significance level.
2022-01-18