SSCI 583: Spatial Analysis PROJECT 4A – SPATIAL MODELING WITH MAXENT
Hello, dear friend, you can consult us at any time if you have any questions, add WeChat: daixieit
SSCI 583: Spatial Analysis
PROJECT 4A – SPATIAL MODELING WITH MAXENT
You ONLY need to select ONE project from 4A or 4B to finish the workflow and report upon your interests.
Workflow Due: April 7 th , 11:59pm PT
Report Due: April 15th, 11:59pm PT
ASSIGNMENT DESCRIPTION
If you choose to complete Project 4a, you will explore the world of spatial modeling, focusing specifically on machine learning using Maxent. Maxent is a program that models species niches and distributions using an analysis technique called maximum entropy modeling. Maxent is often called a black box, insofar as data is inputted and an output is created. This project is designed to help you unpack that “black box” by exploring various parameter options in Maxent. Using environmental layers and georeferenced points, the model expresses a probability distribution where each grid cell has a predicted suitability of conditions for a particular species.
Your goal is to assess the suitability of one agricultural crop of your choice on the island of Hawaii. Specifically, you will use Maxent to analyze environmental conditions at the current locations of your chosen crop to predict other suitable places for planting the same crop across the island.
Assigned readings and web courses are chosen to help you understand and implement appropriate workflows. Data layers for the required analyses are available to you on the SSI server (see below).
As an additional step, you may compare the Maxent output with the output from the Presence-Only Prediction geoprocessing tool in ArcGIS Pro.
You will work with a partner for this assignment (unless you prefer to work on your own). Each partner must complete approximately half the technical work and half the written product. It is not acceptable to have one partner do all the technical work and the other partner do all the writing. Your final report will contain a summary of your individual contributions to the overall project.
LEARNING OBJECTIVES
● Implement the Maxent modeling tool for a specific spatial case
● Choose appropriate parameters for a Maxent model
● Describe statistical methods for validating Maxent models
● Interpret the results of a Maxent model
● Write a succinct description of analyses and results
INSTRUCTIONS
1. Read/watch the following. These readings are recommended sources for background information of the theory and implementation of species distribution modeling in Maxent. The video is a succinct explanation of the meaning of the ROC/AUC tests for assessing models.
● Kalinski, C. 2019. Building Better Species Distribution Models with Machine Learning: Assessing the Role of Covariate Scale and Tuning in Maxent Models. University of Southern California. (Master’s Thesis.)
This award-winning USC SSI thesis looks at covariate settings and default parameters within Maxent. It assessed the role of covariate scales and tuning in Maxent models, ultimately finding that climate and elevation complicated the conclusiveness of the results of the project.
● Phillips, S.J., Anderson, R.P. and Schapire, R.E. 2006. Maximum entropy modeling of species geographic distributions. Ecological Modelling, 190(3-4), pp.231-259.
This is the description of the theory and mathematics that underlie the Maxent program and describes its utility using a case study.
● Smith, A.B. 2020. Best Practices in Species Distribution Modeling: A Workshop in R. The Global Change Conservation Lab at the Missouri Botanical Garden. (URL in Sources and Resources, below)
If you’re interested in using R, you can work through this tutorial, but even if you do not actually work through it in R, the descriptions of the theory of maximum entropy as applied to species distribution modeling and parameter choices in Maxent are helpful and concise.
● StatQuest with Josh Starmer. 2019. ROC and AUC Clearly Explained!
This is a short video that does a nice job of visualizing and explaining common tests for judging model performance.
● Liu, Jie. 2022. Presence-Only Prediction (MaxEnt) 101: Using GIS to model species distribution. Esri blog post access here: https://www.esri.com/arcgis-blog/products/arcgis-pro/analytics/presence-only-prediction-maxent-101-using-gis-to-model-species-distribution/
● Esri Developer Plenary 2022: https://mediaspace.esri.com/media/t/1_9dkfkxcs?co3=true
2. Complete the following tutorial
● Phillips, S.J. 2017. A Brief Tutorial on Maxent. (URL in Sources and Resources, below)
This tutorial provides a basic guide to modeling using Maxent. The region of focus is South America, and the species of focus is the brown-throated three-toed sloth (Bradypus variegatus). It provides guidance as to the various options and parameters available and on output interpretation.
You can download Maxent (URL in Sources and Resources, below) and run it from your computer or access it on the SSI VM.
● If you want to complete the tutorial and work with the Presence-Only Prediction tool in ArcGIS Pro, this will require some self-study in using Notebooks.
3. Inspect your data.
The data for this project was derived from Melrose, J. and Delparte D. (2012) Hawaii County Food Self-Sufficiency Baseline 2012. Geography and Environmental Studies Department, University of Hawaii at Hilo, and is also described in Kemp, K.K., 2012. The Hawai’i Island Crop Probability Map: An Update of the Crop Growth Parameters for the Hawaii County Crop Model. Los Angeles: USC GIS Research Lab (now the Spatial Sciences Institute).
Your data can be found at H:583/HawaiiCropProject or at Brightspace as “Project4a_data.zip”. The folder contains two items:
● EnvLayers: A zipped folder with your environmental data, the contents of which are described below in Tables 3 and 4. The layers are projected into UTM NAD 1983 Zone 5N.
Table 1. Crop Classes
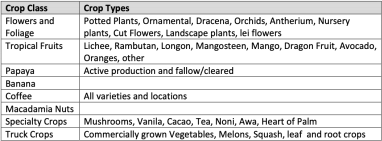
Table 2. Crop Sample Counts
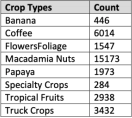
Table 3. Non-Soil Environmental Layers
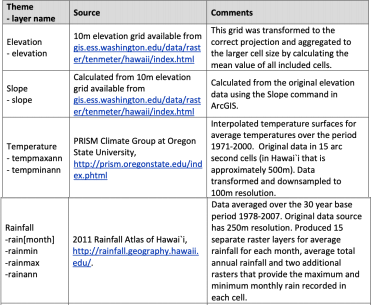
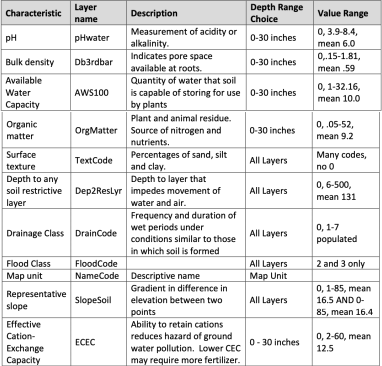
Table 4. Soil Layers
4. Begin the required analysis. Use the following bullet points as a guide for running through the process in Maxent.
● Identify which data layers are categorical and note it in the input options for those layers.
● Do a run using your crop of choice. What does the ROC/AUC suggest? What does it mean?
● Make response curves and interpret how the prediction depends on the variables.
● Determine which variables matter the most using a jackknife to measure variable importance.
● Note the feature classes that Maxent chooses for each data layer. And if you change the feature class for given data layers do your results change?
● Assess the differences between different output formats.
● Explore using different percentages in the “random test percentage”.
● Explore different results using different regularization multipliers.
Note that you can supplement your decision-making for variables and other parameters by doing a bit of research on your chosen crop. For example, what variables have other researchers found most helpful when studying this crop?
5. Write up and share your proposed workflows and initial results. Create a short summary of your workflow and work completed to date and post to the appropriate discussion forum (one per partnership) – you will be marked down if the workflow does not contain technical details. (1.5 pt.)
a. Put “Maxent Model” in the subject line of the post.
b. (If neither partner can attend the synchronous session) Put “NON-SYNCHRONOUS” in the subject line of the post.
c. State the crop that you have chosen to model.
d. Explain the Maxent parameters you’ll need to explore and assess to create a good model for your crop, including choice of variables (e.g. jackknife), feature classes (how you’ll model each chosen variable), etc.
6. Workshop your workflows/initial results with your classmates. Each partner must EITHER attend the synchronous class session to collaborate with classmates to improve each other’s work; OR review the workflows submitted by other students who cannot attend the synchronous session and offer feedback in the Discussion Forum to at least three teams. (1.5 pt.)
7. Revise your proposed workflows as necessary and continue with your work to complete the project.
8. Create basic maps of your study area and maps of your key data sets and results.
● Import your Maxent outputs into ArcGIS Pro and map them. The ASCII to Raster tool can be used to convert your Maxent outputs into a mappable format in ArcGIS.
● All maps should be finished maps, not screenshots of your ArcGIS window, including a comprehensible legend, north arrow, and scale bar.
9. Write up your results in a short report. You should write out prose in complete sentences for each section, not just use bullet points. The report need only be long enough to clearly respond to the listed topics for each of the following sections:
a. Introduction. Provide a brief description of Maxent, the goal of your project, and a quick overview of your data and methods. (.5 pt.)
b. Study area. Describe the area of your study and provide a basic map. (.5 pt.)
c. Methods. Provide a description of steps for achieving your final model output. Your written description should explain and justify ALL your choices – What were the model and parameter choices you made, and why did you make them? Explain your process of exploring various model choices. (4 pts.)
d. Results. Describe your results. Where are the most appropriate areas for growing your crop in Hawaii? This should include an explanation as to what the ROC/AUC response curve tells you about the success of your model. Explain which variables matter the most. Interpret your jackknife plots. Explain your maps. Explain how the regularization multiplier changes the results when you alter the parameters. (3 pt.)
e. Discussion. Provide a critical assessment of your workflow and results. Discuss the prediction, and the way in which it depends on the values of variables as demonstrated in the response curves. You could circle back to the related literature and compare your results with those obtained in case studies you reviewed. How could this analysis be improved? (1 pt.)
f. Appendix. Each partner must itemize their contribution to the overall effort, with each aiming for 50% technical and 50% written contribution. (No points for this, but points may be deducted if the work is not split in this type of way.)
2025-10-10