A Titrimetric Study of the Effect of pH on Carboxyl Content of Oxidised Starch
Hello, dear friend, you can consult us at any time if you have any questions, add WeChat: daixieit
A Titrimetric Study of the Effect of pH on Carboxyl Content of Oxidised Starch
1. Introduction
1.1 Background information
My mom likes to cook and sell her food, and she often uses food packaging such as plastic, but this led to a huge amount of waste that was non-biodegradable. After doing some research, I found that starch which was oxidised could be made into wrapping films as a biodegradable alternative, and I wondered how this typical foodstuff (starch) can be modified through chemical reactions.
The results of this experiment would contribute to the general understanding of the reaction condition, specifically pH, that is necessary to maximise the oxidation of starch as measured by the carboxyl content. While it may be intuitive to know that temperature can increase the rate of oxidation, using high temperatures may incur significant electricity and energy costs to be fully maintained. It is worth investigating other variables that can be used to maximise oxidation, like pH level which can be easily changed by the addition of certain alkaline or acidic substances.
During the investigation itself, some aspect of the methodology was modified to apply my learning. The common method of starch oxidation is to use sodium hypochlorite (in industries), but hydrogen peroxide may be a better reagent for this experiment because it decomposes into oxygen and water. Thus, it is more environmentally friendly. Discovering more about starch oxidation using hydrogen peroxide may benefit research into the possible transition from using sodium hypochlorite to hydrogen peroxide as a reagent in relevant industries.
1.2 Literature review
Apart from creation of biodegradable films, oxidised starch has many applications in other industries, such as paper printing and textile industries. Starch itself can be typically oxidised by a variety of oxidising agents such as sodium hypochlorite and hydrogen peroxide (Tolvanen et al., 2011).
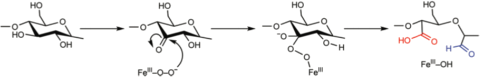
Figure 1.2 - Oxidation of starch by hydrogen peroxide with an iron catalyst (Tolvanen et al., 2011)
The proposed mechanism is seen in Figure 1.2 above, though it should be noted that the reaction mechanism may change depending on the reaction conditions (Dias et al., 2011). At first, the hydroxyl groups undergo oxidation to form carbonyl groups then carboxyl groups (Sukhija et al., 2017). The extent of starch oxidation can therefore be measured by how many carboxyl groups are formed at the end of the reaction. This is expressed as the number of carboxyl groups per 100 glucose units (COOH/100 GU) (Fonseca et al., 2015) or as a percentage.
Previous research has shown that many factors affect the degree of starch oxidation. In particular, starch oxidised with sodium hypochlorite contained the highest amount of carboxyl groups (Yuniar et al., 2019), hence it would be interesting to see if it has the same effect with hydrogen peroxide. Other factors include the concentration of the oxidising agent, temperature and even the drying method used in the case of cassava starch (Dias et al., 2011). For this experiment, pH will be varied while these factors (e.g. temperature, concentration of oxidising agent) are controlled.
In this investigation, starch is reacted as a slurry with hydrogen peroxide, to oxidise OH (hydroxyl) groups to COOH (carboxyl). The pH of this slurry and eventual mixture with hydrogen peroxide is controlled by adding HCl and NaOH. After the reaction, the starch slurry is washed, dried and filtered in order to remove the excess H+ ions (from HCl), Na+ (from NaOH) and other ions that may interfere with the titration. This ensures that the only NaOH which is present in the titration burette is the one reacting with the COOH groups.
1.3 Research question
To what extent does the pH level (pH 4.00 - 9.00) of the reaction affect the percentage carboxyl content of starch oxidised by hydrogen peroxide?
1.4 Hypothesis
The carboxyl content of oxidised starch will be lowest at pH 7.00. As the pH increases or decreases away from pH 7.00, the carboxyl content of oxidised starch will increase.
This hypothesis is in line with studies by that found more acidic (Harmon et al., 1972) or more alkaline pH (specifically pH 8.40 and pH 10.0) (Tolvanen et al., 2009) favours the formation of carboxyl groups compared to a neutral pH.
2. Methodology
2.1 Variables
|
Independent variable |
pH of the reaction (pH 4.00, pH 5.00, pH 6.00, pH 7.00, pH 8.00, pH 9.00) |
|
Dependent variable |
Carboxyl content in starch, which will be measured through titration using NaOH (more detail in Procedure) |
Table 2.1.1 - Independent and dependent variables
|
Controlled variables |
Why it is controlled |
How it is controlled |
|
Temperature |
Temperature affects the rate of reaction. Hence, the amount of carboxyl after starch oxidation would increase with temperature. |
Temperature is kept constant at 35.0°C through the use of a thermostatically-monitored water bath during the oxidation of starch. |
|
This slightly elevated temperature was chosen in comparison to room temperature to increase the rate of reaction and obtain high yield of oxidised starch. If the temperature was too high, some hydrogen peroxide will have naturally decomposed to become oxygen and water, which means the concentration of oxidising agent would not be constant. |
||
|
Reaction time |
Reaction time was found to significantly increase the carboxyl content of oxidised starch (Parovuori et al., 1995) because more hydroxyl groups could be oxidised as time passes, which would introduce a different independent variable. |
The reaction time is kept constant at 10 minutes through the use of a stopwatch to time the reaction. |
|
Concentration of chemicals used |
A change in hydrogen peroxide concentration affects the amount of carboxyl groups present (Dias et al., 2011). Other concentrations (NaOH and HCl) need to be kept constant so as to not change the volume needed for the titration. |
A standard solution of 1.50 mol dm-3 hydrogen peroxide was used throughout the experiment. The concentrations of NaOH and HCl are set at 0.1 mol dm-3 , and titration is carried out with 0.005 mol dm-3 NaOH. |
|
Dry mass of starch |
The mass used for starch is an important component of the final equation, so it should remain constant. |
25.00 g of starch was oxidised per trial. 10.00 g was used in the titration. |
Table 2.1.2 - Controlled variables
2.2 Apparatus and materials
|
Apparatus: 1. Conical flask (500 cm3) 2. Measuring/graduated cylinder (100.0 ± 0.5 cm3) |
Materials: 1. 100 g starch, (C6 H10O5)n 2. 100.0 cm3 of 1.50 mol dm-3 H2O2 3. 200.0 cm3 of 0.1 mol dm-3 NaOH |
|
3. Measuring/graduated cylinder (50.0 ± 0.5 cm3) 4. Beaker (400 cm3) 5. Burette (50.0 ± 0.05 cm3) and stand 6. pH meter (± 0.01) 7. Stopwatch (± 0.01 s) 8. Thermometer (± 0.5 °C) 9. Weighing balance (± 0.01 g) 10. Water bath 11. Filter papers 12. Filter funnel 13. Several droppers 14. Magnetic stirrer 15. Glass rod |
4. 200.0 cm3 of 0.1 mol dm-3 HCl 5. 20.0 cm3 of 0.01 mol dm-3 AgNO3 6. Distilled water 7. Phenolphthalein |
Table 2.2 - List of apparatus and materials along with quantities and uncertainties
2.3 Procedure
The following procedure is adapted from an experiment by Fonseca et al. (2015) with some modifications.
Oxidation of starch by hydrogen peroxide
1. Measure 25.00 g (dry basis) of starch and place in 50.0 cm3 of distilled water in a 400 cm3 beaker and stir with a glass rod to form a starch slurry.
2. Calibrate the pH meter with a standard solution of pH 4.00 and pH 7.00.
3. Place the pH meter in the slurry.
4. Adjust the pH of the starch slurry to pH to pH 4.00 using 0.1 mol dm-3 HCl and 0.1 mol dm-3 NaOH where necessary.
5. Heat the starch slurry at 35.0°C using a water bath and add 30.0 cm3 of 1.50 mol dm-3 H2O2 .
6. After adding H2O2 , maintain the pH at pH 4.00 using the same method described in step 3.
7. Let the mixture react for 10 minutes, timed with a stopwatch.
8. After the reaction, filter the slurry through a filter paper in a filter funnel into a conical flask.
9. Wash the starch slurry with distilled water and refilter through filter paper in a filter funnel.
10. Dry the starch in an oven at 60.0°C for 10 minutes.
11. Repeat steps 1-7 using different pH values: pH 5.00, pH 6.00, pH 7.00, pH 8.00, pH 9.00.
Titration with NaOH
12. Weigh 10.00 g of the dry, oxidised starch.
13. Mix the starch sample in 25.0 cm3 of 0.1 mol dm-3 HCl. Stir using a magnetic stirrer for 30 minutes.
14. Filter the slurry (the residue) and wash with distilled water until there are no chloride ions.
a. To test this, add two drops of 0.01 mol dm-3 AgNO3 solution. If a white precipitate (AgCl) forms, there are still chloride ions. testing the filtrate
15. Place this slurry in 100.0 cm3 of distilled water. in conical flask
16. Heat this starch slurry in a boiling water bath for 15 minutes to gelatinise.
17. Add 0.005 mol dm-3 NaOH into a burette.
18. Add 3 drops of phenolphthalein as an indicator. in the flask
19. Immediately titrate the heated sample with 0.005 mol dm-3 NaOH.
20. Measure the volume of NaOH needed to make the solution reach pH 8.30 in step 17. neutralized
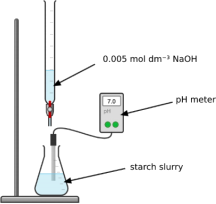
Figure 2.3 - Computer drawn figure of the experimental setup
2.4 Evaluation of procedure
Several important modifications were considered. Originally the titration utilised phenolphthalein as an indicator for the first few trials. This was preferred because the colour change of the indicator would be sharp and quick, allowing the titration to stop immediately close to the equivalence point, in comparison to a pH meter that has a lag time. However, the opaque nature of the starch slurry made the colour change hard to see at times. Hence the titration is done until a pH of 8.30 is reached, and this is in line with other methodologies by Matsuguma et al. (2009). Notably the range pH 8.30 to 10.00 is also when phenolphthalein would sharply turn pink. To prevent overshoot, NaOH should be added in small increments (not continuously) and the reading on the pH meter should stabilise before adding more NaOH.
Additionally, after several preliminary trials, it was found that using 0.010 mol dm-3 NaOH for the titration led to very small titre volumes. Thus the solution was diluted in order to obtain titre values within the 20.0 cm3 to increase precision of the readings (more significant figures).
2.5 Risk assessment
● Safety considerations: H2O2 is a strong oxidiser. Also, skin exposure may result in severe skin burns (Lab Chem, 2017). Though NaOH, HCl and AgNO3 are non-toxic at smaller concentrations, they can still be irritants or caustic in nature. Thus rubber gloves are utilised in handling all chemicals throughout the experiments. A lab coat is also worn along with safety goggles.
● Ethical considerations: There were no ethical considerations to take into account.
● Environmental considerations: Avoid release of chemicals into the environment. Chemicals should not be poured down the sink. Instead all hazardous chemicals should be collected in a specific container for hazardous substances, to be disposed of professionally by the school lab.
3. Data collection
3.1 Qualitative observations
Before heating, starch is insoluble in water. Most of the starch would settle to the bottom of the beaker if not periodically mixed. The resulting suspension is an opaque white colour. In terms of colour, oxidised starch was indistinguishable from unmodified starch.
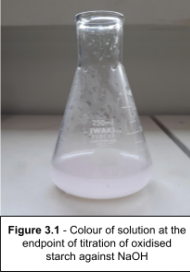
Figure 3.1 shows the suspension, with all the oxidised starch, after initial titration with NaOH until pH 8.30. A faint pink colour is produced in the titration, due to the presence of the phenolphthalein indicator, thus showing that the acidic carboxyl groups have been neutralised. However, this pink colour is faint due to the colour of the starch not being fully colourless. Additionally, it was observed that the pink colour would form, then after stirring, disappear if the colour was not strong enough.
3.2 Raw data
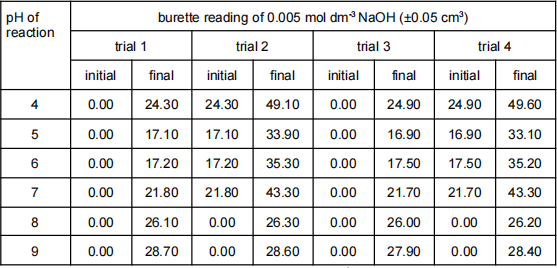
Table 3.2 - Initial and final burette readings of the 0.005 mol dm-3 NaOH titre against oxidised starch.
2025-09-25