Machine Learning and Intelligent Data Analysis Mock Examination
Hello, dear friend, you can consult us at any time if you have any questions, add WeChat: daixieit
School of Computer Science
Machine Learning and Intelligent Data Analysis
Mock Examination
Machine Learning and Intelligent Data Analysis
Question 1 Linear Regression
(a) The expected value of the least squares loss-function for regression is

where h is the true function underlying the data, f is an estimate of h and σ is the standard deviation of the data.
Explain the terms in this expression and their implications for learning.
(b) The graph below shows the fit of a curve 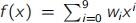 to a set of points
  generated by a noisy underlying process. The independent variable is x and the dependent variable is y . This fit was obtained by solving the normal equations Φ yT = ΦT Φw for the model weights w = (w0 , . . . , w9 )T , where Φ is the basis matrix and y = (y1 , . . . , y11 )T .
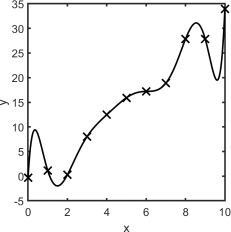
Comment on this fit with reference to Equation (1).
Suggest three ways by which the result could be improved, explaining your reasoning.
(c) Calculate the likelihood p(t|x) that a data point X = (x, t) = (3 , 10) was generated by a function f (x) = 2x + 3 + e, where e is drawn from a normal distribution with mean 0 and standard deviation σ = 1.
Question 2 Clustering and Dimensionality Reduction
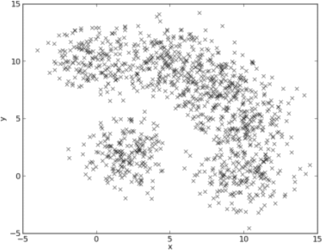
(a) In the following 2D dataset, two clusters of data points can be visually observed. For
this dataset, briefly explain your analysis of whether k-means clustering algorithm (with k = 2) will give the same clustering results as the visual observation of clusters (observable by naked eye). If your answer is yes, describe how k-means will achieve this. If your answer is no, describe why not and suggest an alternative approach to handle such kind of data for clustering. Justify your reasoning.
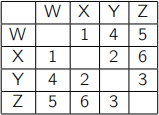
(b) The distance matrix below provides the distance between each pair of objects W, X,
Y, and Z. Using hierarchical agglomerative clustering with complete link, write the cluster formation process, including (i) each merge of objects and/or clusters, (ii) the height after each merge, and (iii) the final dendrogram.
(c) Suppose a 10-dimensional dataset contains 100 measurements. From its covari- ance matrix, the following ten eigenvalues have been obtained. Based upon these eigenvalues, comment about the true dimensionality of this dataset. Justify your answer.
Further, if we wish to project this data into 2-dimensions, indicate which two eigen- values correspond to the eigenvectors we would like to choose. Explain why you made this choice.

(d) One possible approach to searching a large linked set of documents is to combine a measure of document similarity such as TF-IDF similarity with a measure of a page’s importance such as that provided by PageRank. Suggest three ways in which this could be done and discuss the advantages and disadvantages of each of them.
Question 3 Classification
(a) The optimisation problem for Soft-Margin Support Vector Machines is defined as
follows:
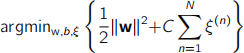
Subject to:

where w and b are parameters of the model, ξ are the slack variables, C is a hyper- parameter, N is the number of training examples, y(n) is the output value of example n , x(n) is the vector of input values of example n and f (.) is the function describing the model.
Suppose someone decides to change this optimisation problem to the following:
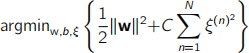
while keeping the same constraints.
What would you expect the impact of such modification to be? Justify your answer.
(b) Consider now that we modify the optimisation problem as follows:
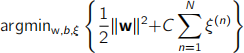
Subject to:

What would you expect the effect of this modification to be? Justify your answer.
2022-01-13