MATH3772 Multivariate Analysis 202021
Hello, dear friend, you can consult us at any time if you have any questions, add WeChat: daixieit
MATH377201
Multivariate Analysis
202021
1. (a) Suppose z ~ N2 (u, Σ), where
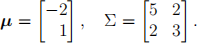
Write z = [x1 x2]/ . Find the conditional distribution of x1 given x2 = 4.3. Explain why the conditional mean differs from the marginal mean, and why the conditional variance differs from the marginal variance.
(b) A statistician has invented a new p-dimensional distribution, p > 1, called the the “dipped multivariate normal distribution” and denoted DN| (α, β). The density takes the form

where α > 0 is called the “shape parameter” and β > 0 is called the “scale parameter”. Using the standard one-dimensional integrals,

it can be shown that the normalizing constant is given by

The distribution gets its name because the density can have a dip at the origin. The following figure shows the density in p = 1 dimension, with α = 1, β = 1.
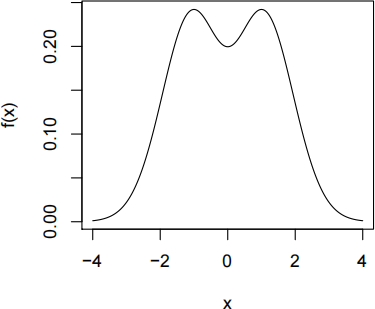
Now specialize to the two-dimensional case, p = 2.
(i) Show that the dipped bivariate normal density is symmetric under sign rever- sals, that is, f (x1 , x2 ) = f (-x1 , x2 ) = f (x1 , -x2 ) = f (-x1 , -x2 ). Hence deduce that the distribution has mean vector 〇 for all choices of the parame- ters.
(ii) Under what conditions on α and β will x1 and x2 be uncorrelated? Justify your answer.
(iii) Under what conditions on α and β will x1 and x2 be independent? Justify your answer.
(iv) Show that the marginal distribution of x1 follows a DN1 (α; , β) distribution with the same scale parameter β and with new shape parameter α; = α + β .
(v) Show that the conditional distribution of x2 |x1 = x0尸1 follows a DN1 (α;; , β) distribution where α;; = α + x0(2) 尸1 .
![]()
2. (a) Dietitians are interested in the amount of nutrition people get from their food. A dietitian carried out a pilot study which measured the calcium intake in a group of n = 15 women aged between 25 and 50. The recommended intake of Calcium is 1000mg per day. In the study the dietician found the sample mean was 648mg and sample standard deviation was 476mg.
On the basis of the information here, carry out a t-test at the significance level α = 0.05 to assess whether or not on average women are getting the recommended amount of calcium in their diet.
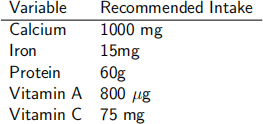
(b) Later it was discovered that the dietitian had presented only a subset of the results of the study. In fact the study looked at 5 nutrients with recommended intakes as follows.
For the full study, the sample means and sample standard deviations were:
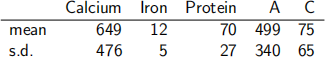
For the purpose of this question, the sample covariance matrix S has not been provided. However, the following intermediate results may be useful,
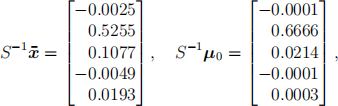
where ![]() is the sample mean vector and u0 is the vector of recommended intakes. Your task is to carry out Hotelling’s T2 test on the full data at a significance level α = 0.05. In particular, show that T2 = 53.6. State carefully the assumptions behind the test, and the hypothesis being tested. If the null hypothesis rejected, construct simultaneous confidence intervals to explain the reasons for rejection. In particular, show that the simultaneous confidence interval for calcium takes the form (56, 1242), where the values have been rounded to the nearest integer.
is the sample mean vector and u0 is the vector of recommended intakes. Your task is to carry out Hotelling’s T2 test on the full data at a significance level α = 0.05. In particular, show that T2 = 53.6. State carefully the assumptions behind the test, and the hypothesis being tested. If the null hypothesis rejected, construct simultaneous confidence intervals to explain the reasons for rejection. In particular, show that the simultaneous confidence interval for calcium takes the form (56, 1242), where the values have been rounded to the nearest integer.
(c) Compare the conclusions from part (a) to the conclusions from part (b), Discuss which analysis is is more appropriate and why.
3. An entomologist (a scientist who studies insects) has collected data on two species of insects, Species 1 and Species 2. Ten individuals were collected from each species, and on each insect three variables were measured:
x1 : width of the 1st joint of the tarsus (legs)
x2 : width of the 2nd joint of the tarsus
x3 : width of the aedeagus (reproductive organ)
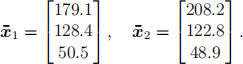
The two sample means are
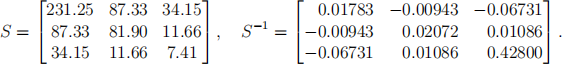
The pooled sample covariance matrix and its inverse are
(a) The objective is to obtain a classification rule to identify the insect species based on these three variables. Because it is easier to measure some variables than others, the entomologist is considering three possible discriminant rules based on Fisher’s linear discriminant function:
(1) the rule based on x1 alone;
(2) the rule based on x1 and x3 ; and
(3) the rule based on all three variables.
Describe the assumptions used to derive Fisher’s linear discriminant function. To what extent are these assumptions compatible across the three cases (1)–(3)?
(b) Evaluate the difference vector d = ![]() 1 -
1 - ![]() 2 and the average vector
2 and the average vector ![]() = (
= (![]() 1 +
1 + ![]() 2 )/2. Using these vectors, construct Fisher’s linear discriminant rule in each of the three cases.
2 )/2. Using these vectors, construct Fisher’s linear discriminant rule in each of the three cases.
(c) Consider a new observation z = (190, 122, 48)/ . Note that for this new ob- servation x1 is closer to the mean of Species 1, x2 is roughly equal to the mean of Species 2, and x3 is on the ’opposite side’ of Species 2 from Species 1? How does each rule in part (b) classify this observation? Why do the three rules yield different results?
(d) Given a classification rule, let p│| denote the probability that an individual from Species j is classified as belonging to Species i, for i, j = 1, 2. These probabilities have been estimated by the parametric method and by cross-validation for the three cases (1)–(3). The results are summarized below in Table 1.
(i) Describe how the parametric estimates depend on the estimated squared Ma- halanobis distance between the means of the two species, and explain how the
cross-validation estimates are obtained.
(ii) Fill in the missing values (*) in the table.
Table 1: Question 3. Estimated misclassification probabilities
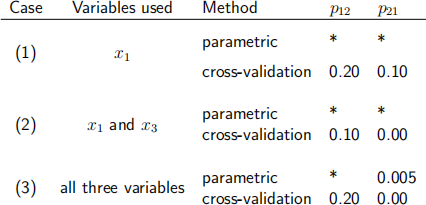
(iii) Give an interpretation of the entries in the table. In particular, compare the parametric to the cross-validation estimates for each case, and compare the cases to one another. What advice would you give the entomologist?
Before you submit your solutions remember to attach a completed Academic Integrity form. We recommend www.smallpdf.com for signing and merging pdf documents.
2022-01-12