AST201 Project 5 Doppler Spectroscopy on a Phone
Hello, dear friend, you can consult us at any time if you have any questions, add WeChat: daixieit
AST201 Project 5
Doppler Spectroscopy on a Phone
Overview
In this project, we will practice the principles of Doppler Spectroscopy using sound waves.
Background Theory
Consider a wave of frequency fs. If the source of the wave is moving at radial velocity vs relative to the receiver, Classical Doppler Effect will cause the received frequency to be shifted to fr:
 Eq. 1
Eq. 1
where C is the speed of the wave; vs is negative if the source is moving away from the receiver, positive if the source is moving towards the receiver. In our experiment, we will observe the Doppler shifts of sound waves that are governed by the classical Doppler effect. (Doppler shifts of light follow the relativistic Doppler effect. The equations differ slightly, but the principles are the same.)
Procedures
[Preparation]
• You will need two general-purpose mobile computing devices that are equipped with microphone and speaker (such as cellphone, tablet, laptop, etc.). At least one of the devices should have access to Apple App Store or Google Play Store.
• Install Phyphox® app on one (or both) device through Apple App Store or Google Play Store.
• You will need a room with low background noise. If you do not have access to a quiet room, please contact the course instructor to use a lab space at UTM.
• Note that you will produce some buzzer noise during the experiment. You might want to ask for permission from the people who share the space with you (if applicable).
[Doppler Spectroscopy Experiment]
1. On the device that has Phyphox app installed, tap on “Doppler Effect” in the Phyphox app. [This device will be the receiver of the sound waves.] For all measurements below, keep the receiver stable and untouched during recording.
2. If your other device also has Phyphox app installed, tap on “Tone Generator” in the Phyphox app. Otherwise, open this tone generator website: https://onlinetonegenerator.com/using any browser on that device. [This device will be the source of the sound waves.]
3. (Check background noise) On the receiver, make sure that the “base frequency” is set at 1000Hz (default value), then switch to the “results” tap and press the play (“►”) button to start recording. Keep the receiver stable and untouched during recording. Walk a few steps back and forth. Notice that the receiver should detect your footstep sounds as intermittent random noise. Take a screenshot of the current data screen, then press the trashcan symbol to clear data.
4. On the source, set the frequency to 1000Hz, and play the sound. Adjust the volume so that the sound is not “annoyingly loud” at close but also clearly audible at about 3 meter distance. Many modern devices have more than one speaker. If your source has more than one speaker, make sure not to keep the source too close to the receiver. (If you use the Phyphox tone generator, note that you must hit “enter” or close the numpad before the new frequency takes effect.)
5. (Doppler measurement on radial velocity at close distance) Start a new recording on the receiver. Leave the receiver stable and untouched. As you are standing close to the receiver, quietly move the source back-and-forth from the receiver 5 times in total, with a short pause between each stroke of motion. You should see the “frequency” and the “speed” of the source being recorded on the two diagrams of the Phyphox app on the receiver. Stop recording, take a screenshot of the current data screen, then clear the current data. (An example data is shown below. If you see too much noise or variability in this data, clear it and try again with a different source volume or orientation.)
6. (Doppler measurement on radial velocity at far distance) Start a new recording on the receiver. Take the source in hand and walk three steps (about 3 meters) away from the receiver. As you are standing far from the receiver, quietly move the source back-and-forth from the receiver 5 times in total, with a short pause between each stroke of motion. Stop recording, take a screenshot of the current data screen, then clear the current data. (An example data is shown below. Depending on the actual distance, the cycles should be somewhat less prominent on the data curves but still visible.)
7. (Doppler measurements on transverse velocity at close distance) Start a new recording on the receiver. As you are standing close to the receiver, quietly move the source left-and-right relative to the receiver 5 times in total, with a short pause between each stroke of motion. Stop recording, take a screenshot of the current data screen, then clear the current data.
8. (Doppler measurements on transverse velocity at far distance) Start a new recording on the receiver. As you are standing far from the receiver, quietly move the source left-and-right relative to the receiver 5 times in total, with a short pause between each stroke of motion. Stop recording, take a screenshot of the current data screen, then clear the current data.
9. Before you lose track of which screenshot is which measurement, you might want to transfer the screenshots to your computer now and rename them properly.
[Sound Intensity Control Experiment]
10. On the receiver, exit the “Doppler Effect” measurement and open the “Audio Amplitude” measurement. This measurement simply measures the loudness of the sound. For all measurements below, keep the receiver stable and untouched during recording.
11. (Intensity measurement at close distance) Start a new recording on the receiver. As you are standing close to the receiver, quietly move the source back-and-forth from the receiver 5 times in total, with a short pause between each stroke of motion. Stop recording, take a screenshot of the current data screen, then clear the current data.
12. (Intensity measurement at far distance) Start a new recording on the receiver. Take the source in hand and walk three steps (about 3 meters) away from the receiver. As you are standing far from the receiver, quietly move the source back-and-forth from the receiver 5 times in total, with a short pause between each stroke of motion. Stop recording, take a screenshot of the current data screen, then clear the current data.
[Tips from former AST201 students]
• You can use an external microphone (such as one on a headset) to improve sound quality.
• Echoes from walls nearby may affect your measurements.
• In Phyphox app, Tap on the data curve and use the “pick data” tool to select data.
Minimal list of tasks
Please complete Tasks i-vi and Tasks vii-xi in separate documents and upload them on Crowdmark.
i. Crop all your screenshots to keep only the data curves (to save space in your report).
ii. Attach the data curves ofthe background noise from Step 3 above.
iii. Attach the data curves ofthe Doppler measurement of radial velocity at close distance from Step 5 above.
iv. On the data curve from Step 5 (i.e., Task-iii), indicate the time points when the source is moving at speeds fastest away from the receiver.
v. On the data curve from Step 5, indicate the time points when the source is at distances farthest from the receiver.
vi. On the data curve from Step 5, pick any point at which the source was moving. Indicate this data point on the curve. Read both the frequency and the speed from the two curves, and show (with calculation) that these values are consistent with Eq. 1. (Use speed of sound c = 340m/s.)
vii. Attach the data curves of Doppler measurement of radial velocity at far distance from Step 6 above.
viii. Attach the data curves of Intensity measurement at close distance from Step 11 above.
ix. Attach the data curves of Intensity measurement at far distance from Step 12 above.
x. Based on the data curves of Steps 5, 6, 11, 12 above, discuss why (in astronomy) Doppler measurements are routinely and conveniently used for radial velocities, but light intensity measurements are not used to measure radial velocities.
xi. Attach the data curves of Doppler measurement of transverse velocity at close and far distances from Steps 7 and 8 above.
a. Discuss why our measurements can detect transverse motion, but measurements on stars cannot. Did we truly detect transverse velocity in our measurements?
b. Do one more test measurement with different experimental settings to confirm your explanation.
Please complete Tasks i-vi and Tasks vii-xi in separate documents and upload them on Crowdmark.
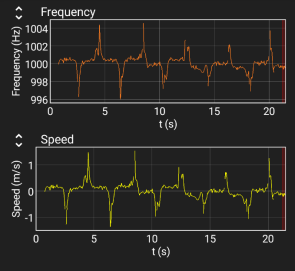
Left figure: Example data for Step 5
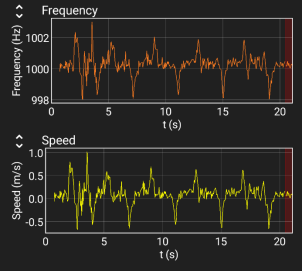
Right figure: Example data for Step 6
2025-08-09