MSCI 212 Statistical Methods for Business 2021-2022
Hello, dear friend, you can consult us at any time if you have any questions, add WeChat: daixieit
2021-2022 COURSEWORK
MANAGEMENT SCIENCE
MSCI 212 Statistical Methods for Business
Question 1
As in Workshop 2, use <Transform><Random Number Generators> to set your unique starting point for the SPSS random number generator. For this coursework question use the last four digits of your library card (i.e., your Student ID number) PLUS 1, i.e. if your library card ends ‘4321’ type in ‘4322’, and if your library card ends ‘4329’ type in ‘4330’. Record these four digits at the top of your answer. Your final mark will be penalised if you use a different starting point than the one based on your library card, unless you have permission to do so from the module convenor.
Credit card companies determine whether or not to accept an application for a credit card based on the applicants credit history and their current circumstances. A company have asked you to provide a brief report describing the features of the people in the sample applying for a credit card, and to evaluate which features appear to influence the decision to accept or reject applicants.
The SPSS data file ‘CreditCard.sav’ contains the following data for 1319 assessed applications for a credit card:
• Card – Was the application for a credit card accepted? (0 = No, 1 = Yes);
• Reports – Number of major derogatory credit reports;
• Age – Age in years plus twelfths of a year;
• Income – Yearly income (in USD 10,000);
• Share – Ratio of monthly credit card expenditure to yearly income;
• Expenditure – Average monthly credit card expenditure;
• Owner – Does the individual own their home? (0 = No, 1 = Yes);
• Dependents – Number of dependents;
• Months – Months living at current address;
• Active – Number of active credit accounts.
Draw a random sample of size 200 from this population and investigate your sample using SPSS.
a) In no more than 6 pages describe the main features of the applicants in your sample, as if reporting to the company’s management. You should include the main features of individual variables and of the relationships between them. For this analysis, do not include the company’s decision variable “Card”. You may include SPSS numerical and graphical output and/or you may quote values from your SPSS output. (The clarity and content of your report are both important). [Worth about 75% of the marks for Q1]
b) Use your sample as evidence to explain what you believe to be the features that influence the acceptance or rejection decision made by the company, as represented by the variable “Card”. [No more than 2 pages. Worth about 25% of the marks for Q1]
Data source: Greene, W.H. (2003). Econometric Analysis, 5th edition. Upper Saddle River, NJ: Prentice Hall
Question 2
You should include key parts of your SPSS output in your answer. You must explain your answer clearly and you are limited to a maximum of 8 pages.
The major utilities (water, gas, electricity, etc.) employ and contract field engineers to maintain assets (e.g. pipelines, cables, machinery) and resolve issues (e.g., faults) so that their services can be provided with little disruption to customers. In telecoms, these engineers perform planned inspections and maintenance on the network, install services for customers, and repair faults on the network. Field engineers are allocated to perform these jobs in different regions across the UK, called sectors.
The numbers of engineers allocated to sectors vary widely, for various good reasons (e.g. rural sectors have different demands than urban) and some not so good reasons (e.g. periodically insufficient engineers or contractors to meet demands during certain times of the year). Data from 120 randomly sampled sectors in the UK have been gathered (see file EngineerWorkloads.sav) to see whether regression models can be used to determine any underlying relationships between engineer staffing levels and sector workloads. The available data is as follows:
• Engineers – No. of engineer-hours employed during 2020 (one engineer-hour is equivalent to one engineer working for 1 hour);
• Maintenance – Number of maintenance jobs scheduled in 2020;
• Faults – Number of fault (or repair) jobs scheduled in 2020;
• Inspections – Number of inspection jobs scheduled in 2020;
• Installations – Number of customer installation jobs scheduled in 2020.
a) Carry out a preliminary analysis of the data using Scatterplots, Correlations, and anything else you think appropriate. Report your preliminary findings.
b) Use multiple linear regression to investigate the relationship between Engineers and the 4 available explanatory variables. Justify your choice of model.
c) Carry out a residuals analysis to check whether or not the usual regression assumptions seem to hold for your preferred model. Carefully justify your conclusions, noting any reservations you have about your equation. In particular, is there any evidence of sectors which may have mis-recorded the number of engineer-hours or jobs?
d) In light of your answer to c) carry out any further improvements to your model you think appropriate (if any), and explain why you believe it is an improvement.
e) Use your preferred model to comment carefully on the reported engineer staffing levels of three further sectors (X, Y & Z) which were 12,000, 68,000 and 70,000 engineer-hours respectively. Their corresponding workload figures were:
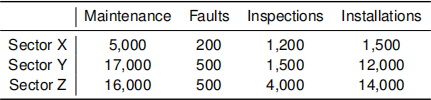
2022-01-11