BUSI3122-E1 INTRODUCTION TO DATA SCIENCE: BIG DATA ANALYSIS IN BUSINESS 2019-2020
Hello, dear friend, you can consult us at any time if you have any questions, add WeChat: daixieit
BUSI3122-E1
BUSINESS SCHOOL
A LEVEL 3 MODULE, AUTUMN SEMESTER 2019-2020
INTRODUCTION TO DATA SCIENCE: BIG DATA ANALYSIS IN BUSINESS
Question 1. Decision Tree
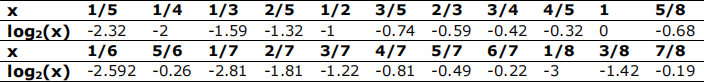
For this question the following log table may be useful:
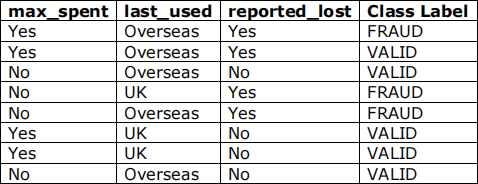
Consider the training set in the following table, representing a set of features collected about credit cards being used fraudulently by a credit card company:
1) What is the entropy of the class labels in the root node (i.e. the full training dataset)?
2) What is the IG when splitting on the “max_spent” attribute?
3) What is the IG when splitting on the “last_used” attribute?
4) What is the IG when splitting on “reported_lost”?
5) Given the first split will be “reported_lost” for the Tree Induction, determine the leaf node groupings, continue the splitting process and graphically illustrate the full tree.
6) With what confidence would the final model from (5) make a prediction for the input features: max_spent = NULL, last_used = overseas and reported_lost = no, where NULL represents the fact that the value for the feature max_spent is unknown?
7) A naive Bayes classifier would make the same prediction when receiving a test feature vector <NULL, overseas, no>. However, would the probability it returned for its confidence in that prediction be the same? Why?
8) Describe the different methods in addressing overfitting for tree classification approach?
Question 2. Logistic Regression
The dating web site Jiayuan.com requires its users to create profiles based on a survey in which they rate their interest (on a scale from 0 to 3) in five categories: physical fitness, music, spirituality, education, and alcohol consumption. A new Jiayuan customer, Joseph NoBody, has reviewed the profiles of 40 prospective dates and classified whether he is interested in learning more about them.
Based on Joseph's classification of these 40 profiles, Jiayuan has applied a logistic regression to predict Joseph’s interest in other profiles that he has not yet viewed. The resulting logistic regression model is as follows:
Log odds of Interested = –0.920 + 0.325 × Fitness – 3.611 × Music
+ 5.535 × Education – 2.927 × Alcohol
For the 40 profiles (observations) on which Joseph classified his interest, this logistic regression model generates that following probability of Interested.
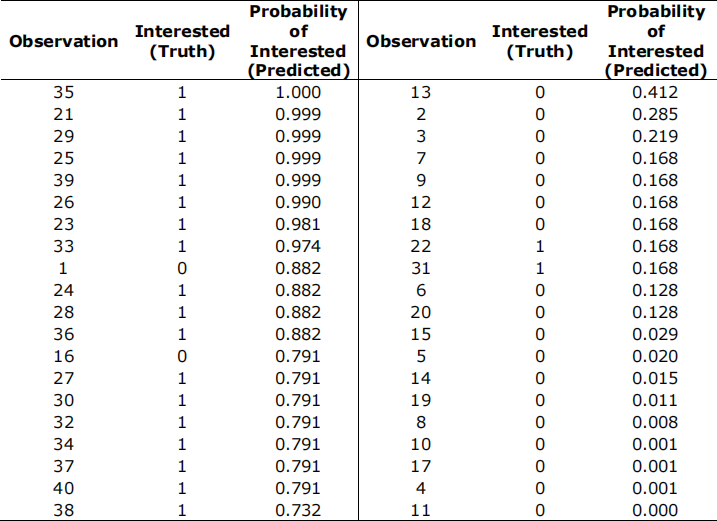
a) Using a cutoff value of 0.5 to classify a profile observation as Interested or not, construct the confusion matrix for this 40-observation training set. Compute sensitivity, specificity, and precision measures and interpret them within the context of Joseph's dating prospects.
b) Based on the logistic regression result table, construct the ROC curve and calculate the AUC. Hint: the ROC curve is a set of line segment that either parallel or vertical to the x axis.
c) A recently posted profile has values of Fitness = 3, Music = 1. Education = 3, and Alcohol = 1. Use the estimated logistic regression equation to compute the probability of Joseph’s interest in this profile.
d) Now that Jiayuan has trained a logistic regression model based on Joseph’s initial evaluations of 40 profiles, what should its next steps be according to the CRISP-DM
process? And elaborate these steps in a few sentences giving the context
Question 3. KNN
Unbeknownst to his students, in his spare time Professor Mahe Soundstrange is extremely multi-skilled, and has set up a tailor’s business. Mahe has had an order and wrote down the customer’s during a phone call with them, along with the customers measurements... but it was weeks ago, and their voice was somewhat muffled... and now he can’t remember if the order was for men’s or women’s trousers. In fact, he can’t recall if the customer was even male or female!
Mahe was about to toss the coin to know what to make - when you let him know that in FBA you’ve learnt how to make a prediction based on previous data! Can you help him make a better decision using a kNN classifier?
• The customer who we are missing information for had a waist measurement of 29” and a leg-length measurement of 34”.
• Mahe’s prior customers had these measurements:
o Male, 28” waist, 30” leg-length
o Male, 33” waist, 35” leg-length
o Female, 26” waist, 30” leg-length
o Female, 25” waist, 29” leg-length
o Female, 28” waist, 32” leg-length
a) Classification
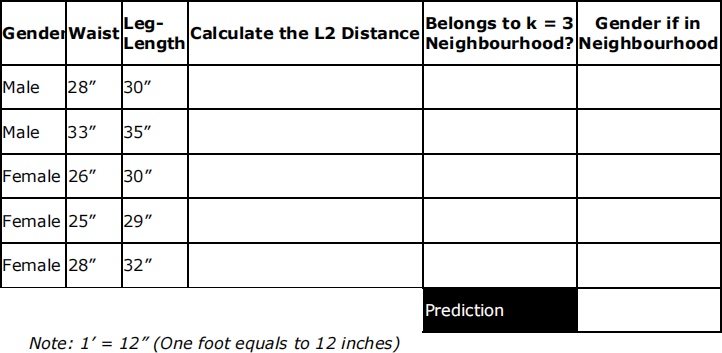
Use a nearest neighbourhood approach where K=3 and the L2 distance measure to deduce Mahe’s prediction based on previous clients (fill up the following table as a guidance to deduce the prediction):
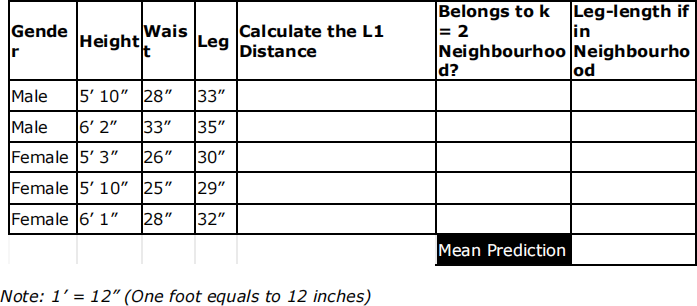
b) Regression
Turns out you were correct, and Mahe ended up with a very happy customer! In fact, the customer wants to make another order for a friend as a Christmas present. Unfortunately, she doesn’t know her friend’s measurements and wants Mahe to take a guesstimate - she only knows that this friend is 5’ 10” tall and has a waist of 26”. Right, you’re up again to try and guess that hip measurement....
Using your new data, augmented set to calculate a KNN regression prediction of the new customer’s leg-length, using k = 2 and absolute distance to examine your test data points distance based on Height and Waist.
c) In question (a) and (b), we just assume that height, waist and leg-length have similar and comparable scales. In general, certain DM method requires normalization and standardization process. Please explain these two concepts.
d) Please apply normalization to both (a) and (b), present the results and find out whether results will be different after normalization.
e) What is overfitting and why is it important to avoid in Business Analytics?
f) Describe how overfitting is addressed within a nearest neighbour classification approach?
Question 4. Clustering and K-means
As an analyst within an investment firm, I would like to see whether my investment customers tend to cluster in understandable groups.
a) What precisely is the difference between segmenting my customers using k-mean clustering and segmenting my customers using tree induction, and when would I use one rather than the other? What is the practical difference — i.e., in the data mining process where and what would the main differences be?
b) Describe the concept of ‘distance’ that I need in order to apply clustering to my customer data.
c) Considering that you answered part (b), what might still be very unclear for you before running k-means algorithm?
d) Describe another type of clustering method that I should consider. How is it different from k-means?
e) Once I get clusters, it is important for me to see if I can understand the meaning of the clusters. Describe three ways to help understand the resultant clustering (as discussed in the book).
f) How can ensemble learning (e.g. random forests) help address overfitting?
g) What is cross-validation and how does it work?
2022-01-10