ECO00032M Investment and Portfolio Management 2018
Hello, dear friend, you can consult us at any time if you have any questions, add WeChat: daixieit
ECO00032M
MSc Degree Examinations 2018
DEPARTMENT OF ECONOMICS & RELATED STUDIES
Investment and Portfolio Management
Answer any THREE questions
1. Suppose that there are two risky stocks, A and B , with characteristics as given in the table below. Riskless borrowing and lending is possible at rate rf = 5%.
Stock Mean return (%) Std.Dev.(%) Cov(rA ;rB )
A 12 8 10
B 8 4
(a) [10 marks] Compute the expected return and standard deviation of the global minimum variance portfolio of risky assets.
Answer: The minimum-variance portfolio is computed as follows:
wMin (A) =
=
wMin (B) =
g B(2) 一 Cov(rA ;rB )
g A(2) + g B(2) 一 2 × Cov(rA ;rB )
0:1;
1 一 wMin (A) = 0:9
The minimum variance portfolio mean and standard deviation are:
E(rMin ) = (0:1 × 12%) + (0:9 × 8%) = 8:4%
g Min(2) = 0:12 × 82 + 0:92 × 42 + 2 × 0:1 × 0:9 × 10 = 15:4 gMin = (gMin(2))1=2 = 3:9243%
(b) [8 marks] In the tangent portfolio, the fraction of wealth invested in asset A is 40:2%. Determine the Capital Allocation Line (CAL) with maximum slope. [Note: For the CAL, E[rP ] = a + bgP , Önd the coe¢ cients a and b.]
Answer: The intercept in the CAL is the risk free rate, rf = 5%. The slope coe¢ cient is the Sharpe ratio. The expected return on the tangent portfolio is:
E(rT ) = (0:402 × 12%) + (0:598 × 8%) = 9:608%
gT(2) = 0:4022 × 82 + 0:5982 × 42 + 2 × 0:402 × 0:598 × 10 = 20:8722
gT = (gT(2))1=2 = 4:5686%
The Sharpe ratio is:
ST = ![]() 一 rf =
一 rf = ![]() 86(一)5 = 1:0086
86(一)5 = 1:0086
Thus, the CAL is:
E[rT ] = 5% + 1:0086 × gP
(c) [7 marks] Assume that your client has quadratic utility: U = E[rP ] 一 ![]() AgP :
AgP :
If your client has a degree of risk aversion A = 1=2, what is the optimal allocation between the risk-free asset and the tangent portfolio?
Answer: If the student used the usual quadratic utility function: U = E[rP ] 一 ![]() Ag P(2): Maximizing the utility function gives the solution to the portion of funds invested in the risky portfolio:
Ag P(2): Maximizing the utility function gives the solution to the portion of funds invested in the risky portfolio:
y* = ![]()
![]() rf =
rf = ![]() 一:87(5)22 = 0:4415:
一:87(5)22 = 0:4415:
It follows that the portion invested in the risk-free asset is
1 一 y* = 0:5585
2.
(a) [10 marks] Consider two regression lines for stocks A and B in the following Ögures.
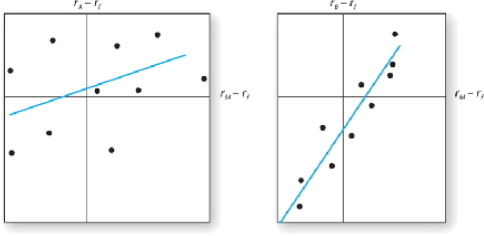
● Which stock has higher Örm-speciÖc risk?
● Which stock has greater systematic (market) risk?
● Which stock has higher R2 ?
● Which stock has higher alpha?
● Which stock has higher correlation with the market?
Answer:
● The two Ögures depict the stocksísecurity characteristic lines (SCL). Stock A has higher Örm-speciÖc risk because the deviations of the observations from the SCL are larger for Stock A than for Stock B. Deviations are measured by the vertical distance of each observation from the SCL.
● Beta is the slope of the SCL, which is the measure of systematic risk. The SCL for Stock B is steeper; hence Stock B ís systematic risk is greater.
● The R2 (or squared correlation coe¢ cient) of the SCL is the ratio of the explained variance of the stockís return to total variance, and the total variance is the sum of the explained variance plus the unexplained variance (the stockís residual variance):
R2 = β i(2)g M(2)
βi(2)gM(2) + g2 (ei )
● Since the explained variance for Stock B is greater than for Stock A (the explained variance is β i(2)g M(2), which is greater since its beta is higher), and its residual variance g2 (ei ) is smaller, its R2 is higher than Stock Aís.
● Alpha is the intercept of the SCL with the expected return axis. Stock A has a small positive alpha whereas Stock B has a negative alpha; hence, Stock Aís alpha is larger.
● The correlation coe¢ cient is simply the square root of R2 , so Stock B ís correlation with the market is higher.
(b) [8 marks] Consider the following multifactor (Arbitrage Pricing Theory) model of
security returns for a particular stock.
Factor Factor Beta Factor Risk Premium
Ináation 1.2 6%
Industrial production Oil prices
0.5
0.3
8%
3%
If T-bills currently o§er a 6% yield, Önd the expected rate of return on this stock if the market views the stock as fairly priced.
Answer:
E(r) = 6% + 1:2 × 6% + 0:5 × 8% + 0:3 × 3% = 18:1%
(c) [7 marks] For the stock considered in (b), suppose that the market expected the values for the three macro factors given in column 1 below, but that the actual values turn out as given in column 2. Calculate the revised expectations for the rate of return on the stock once the "surprises" become known.
Factor Expected rate of change Actual Rate of Change
|
Ináation |
5% |
4% |
|
Industrial production |
3% |
6% |
|
Oil prices |
2% |
0% |
Answer: The revision of the rate of return is given by:
1:2 × (4% 一 5%) + 0:5 × (6% 一 3%) + 0:3 × (0 一 2%) = 一0:3% Thus, the revised expectation for the rate of return is:
E(r) = 18:1% 一 0:3% = 17:8%
3.
(a) [10 marks] Brieáy describe the impact of Öscal policy and monetary policy on the economy.
Answer: Fiscal policy:
● Most direct way to stimulate or slow the economy
● Formulation of Öscal policy is often a slow, cumbersome political process
● To summarize the net e§ect of Öscal policy, look at the budget surplus or deÖcit
● DeÖcit stimulates the economy because it increases the demand for goods (via spending) by more than it reduces the demand for goods (via taxes)
Monetary policy:
● Manipulation of the money supply to ináuence economic activity
● increasing the money supply lowers interest rates and stimulates the economy
● less immediate e§ect than Öscal policy
● tools of monetary policy include: open market operation, discount rate, reserve requirements.
(b) [8 marks] What sorts of factors might limit the ability of rational investors to take advantage of any "pricing errors" that result from the actions of "behavioral investors"?
Answer: One of the major factors limiting the ability of rational investors to take advantage of any ëpricing errorsíthat result from the actions of behavioral investors is the fact that a mispricing can get worse over time. An example of this fundamental risk is the apparent ongoing overpricing of the NASDAQ index in the late 1990s. Related factors are the inherent costs and limits related to short selling, which restrict the extent to which arbitrage can force overpriced securities (or indexes) to
move towards their fair values. Rational investors must also be aware of the risk that
an apparent mispricing is, in fact, a consequence of model risk; that is, the perceived mispricing may not be real because the investor has used a faulty model to value the security.
(c) [7 marks] What is the biggest issue with implementation of the Treynor-Black model? Explain.
Answer: TB portfolio weights are sensitive to large alpha values, which can result in practically infeasible long/short portfolio positions. The common "complaint" is that the TB model results in "wild" portfolio weights. Yet, those wild portfolio weights are a consequence of failing to adjust alpha values to reáect forecast precision. Any realistic R一square that can be obtained even by excellent forecasters will result in moderate portfolio weights. Even when "wild" weights do occasionally materialize, they can be "tamed" by a straightforward restriction on benchmark risk.
4.
(a) [10 marks] The Generic Genetics (GG) Corporation pays no cash dividends currently and is not expected to for the next 4 years. Its most recent EPS was a5, all of which was reinvested in the company. The Örmís expected ROE for the next 4 years is 20% per year, during which time it is expected to continue to reinvest all of its earnings.
Starting in year 5, the Örmís ROE on new investments is expected to fall to 15% per year. GGls market capitalization rate is 15% per year. What is your estimate of GGís intrinsic value per share?
Answer:
Time 0 1 2 3 4 5
Earnings 5 6 7:2 8:64 10:368 11:923
Dividends 0 0 0 0 0 11:923
![]() Dividends = 0 for the next four years, so b = 1:0 (100% plowback ratio).
Dividends = 0 for the next four years, so b = 1:0 (100% plowback ratio).
![]() D5 E5 (1 一 b)
D5 E5 (1 一 b)
k 一 g k 一 ROE × b
E5 (1 一 b) E5
= =
k(1 一 b) k
![]() a11:923
a11:923
0:15
Since k = ROE , knowing the plowback rate is unnecessary.
![]() P4 a79:488
P4 a79:488
(1 + k)4 1:154
(b) [8 marks] A Örm has an ROE of 3%, a debt-to-equity ratio of 0:5, a tax rate of 35%, and pays an interest rate of 6% on its debt. What is its operating ROA?
Answer:
ROE = (1 一 t) × ┌ROA + (ROA 一 Interest rate) × ![]() ┐
┐
0:03 = 0:65 × [ROA + (ROA 一 0:06) × 0:5]
ROA = 5:08%
(c) [7 marks] The Crusty Pie Co., which specializes in apple turnovers, has a return on sales higher than the industry average, yet its ROA is the same as the industry
average. How can you explain this?
Answer:
ROA = ROS × ATO
The only way that Crusty Pie can have an ROS higher than the industry average and an ROA equal to the industry average is for its ATO to be lower than the industry average.
5.
(a) [10 marks] The scatterplots of four managers performances are plotted in the following diagrams. Brieáy evaluate their:
● market timing ability
● security selection ability
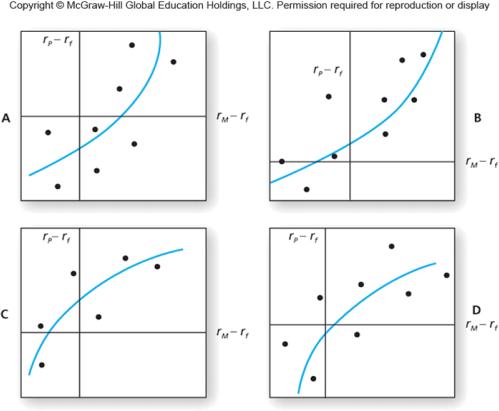
Explain.
Answer: We need to distinguish between market timing and security selection abilities. The intercept of the scatter diagram is a measure of stock selection ability. If the manager tends to have a positive excess return even when the marketís performance is merely ìneutralî(i.e., has zero excess return), then we conclude that the manager has on average made good stock picks. Stock selection must be the source of the positive excess returns.
Timing ability is indicated by the curvature of the plotted line. Lines that become steeper as you move to the right along the horizontal axis show good timing ability. The steeper slope shows that the manager maintained higher portfolio sensitivity to market swings (i.e., a higher beta) in periods when the market performed well. This ability to choose more market-sensitive securities in anticipation of market upturns is the essence of good timing. In contrast, a declining slope as you move to the right means that the portfolio was more sensitive to the market when the market did poorly and less sensitive when the market did well. This indicates poor timing.
We can therefore classify performance for the four managers as follows:
Selection Ability Timing Ability
|
A |
Bad |
Good |
|
B |
Good |
Good |
|
C |
Good |
Bad |
|
D |
Bad |
Bad |
(b) [8 marks] Based on current dividend yields and expected capital gains, the annual expected rates of return on portfolios A and B are 12% and 16%, respectively. The beta of A is 0:7, while that of B is 1:4. The T-bill rate is currently 5%, whereas the expected rate of return of the S&P 500 index is 13%. The standard deviation of portfolio A is 12% annually, that of B is 31%, and that of the S&P 500 index is 13%. The standard deviation of the market portfolio is 10%.
If you currently hold a market-index portfolio, would you choose to add either of these portfolios to your holdings? If so, which one? Explain.
Answer: The alphas for the two portfolios are:
aA = 12% 一 [5% + 0:7 × (13% 一 5%)] = 1:4% aB = 16% 一 [5% + 1:4 × (13% 一 5%)] = 一0:2%
To Önd information ratios we need to Önd Örst the standard deviations of the
idiosyncratic risk in portfolios A and B. For portfolio A we have
122 = 0:72 × 102 + g2 (eA )
g2 (eA ) = 95
g(eA ) = 9:7477
Similar calculations for portfolio B gives
g2 (eB ) = 765
g(eB ) = 27:6586
The information ratios are:
IRA = ![]() = 0:1436
= 0:1436
IRB = 2一7:![]() = 一0:0072
= 一0:0072
Ideally, you would want to take a long position in Portfolio A and a short position in Portfolio B. If you seek an active portfolio to mix with an index portfolio, portfolio A is better due to its higher information ratio.
(c) [7 marks] If instead you could invest only in T-bills and one of these portfolios from (b), which would you choose? Explain.
Answer: If you will hold only one of the two portfolios, then the Sharpe measure is the appropriate criterion:
12% 一 5%
SA = = 0:583
12%
16% 一 5%
SB = = 0:355
31%
Using the Sharpe criterion, Portfolio A is the preferred portfolio.
2022-01-08