AcF 351b Python Stream Final Exam Part II
Hello, dear friend, you can consult us at any time if you have any questions, add WeChat: daixieit
AcF 351b Python Stream Final Exam Part II
This is the second part of the final exam for AcF 351b: Python Stream.
Students are expected to act according to the highest ethical standards. All students enrolled at Lancaster University are to perform their academic work according to standards set by faculty members, departments, schools and colleges of the university; and cheating and plagiarism constitute fraudulent misrepresentation for which appropriate sanctions are warranted and will be applied. Please note that any form of violation of the following rules will be treated as plagiarism
1. Answer the questions yourself without asking others for assistance. This is a test of your ability of data science and computer programming.
2. Do not share the questions or your answers with anyone. This includes posting the questions or your solutions publicly on services like quora, stackoverflow, or github.
We will run a system to detect any kind of plagiarism, e.g., coding scripts with high similarities.
Do NOT erase the #export at the top of any cells as it is used by notebook2script.py to extract cells for submission.
Do NOT change the following cell!
In [ ]:
|
#export import pandas as pd import numpy as np from pandas.tseries.offsets import MonthEnd, QuarterEnd, QuarterBegin from dateutil import parser import time import matplotlib.pyplot as plt try : import wrds except : !pip3 install wrds |
If you need extra modules, use the following cell to import them
In [ ]:
#export
# imported extra moduels:
In this notebook, you are going to analyze the data of U.S. and U.K corporate bonds in the U.S. market. For
corporate bonds, the typical variable of interest is bond yield (https://www.investopedia.com/terms/b/bond- yield.asp). We are not going to elaborate the definition of bond yield and how bond yield is calculated. For our
purpose, we only need to know that bond yields are inversely related to bond prices. If investors prefer holding some bonds, the price of the bonds increases and, consequently, the yield decreses.
acf351b_bonds.csv provides historical yields and trading quantities for a sample of U.S. and U.K. bonds in the U.S. market between Jan 2015 and Dec 2017.
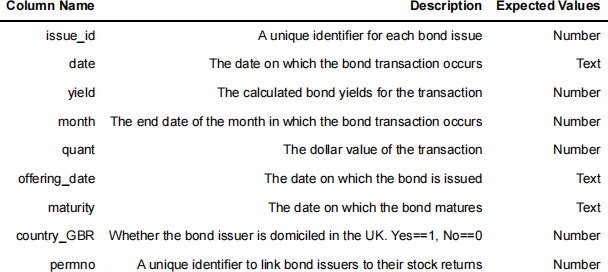
The following table shows the data dictionary.
The following code script reads the data into the memory, and passes it to a dataframe named df. DO NOT
CHANGE IT.
However, you can add extra code cells below it to have an overview.
In [ ]:
|
#export df = pd.read_csv("https://frankxu1987.weebly.com/uploads/6/2/5/8/62583677/acf351b_bonds.csv") df['date']=pd.to_datetime (df['date'], format="%Y-%m-%d") df.head(1) |
We are going to make use of the data on WRDS. The following code script establishes the connection to WRDS database.
In [ ]:
#export
conn = wrds.Connection ()
Question 1: Using SQL to retrieve data of stock returns and compute 90-day return volatilities
CRSP is a dataset of historical stock prices (variable: prc) and stock returns (variable: ret) for most stocks listed in the U.S. stock exchanges. Each stock has a unique identifier called permno. In this question, we are going to write PostgreSQL scripts to retrieve stock returns for all bond issuers in our bond data df.
Question 1.1: write a piece of SQL scripts to retrieve stock return (variable: ret) and stock trading date (date) from CRSP (dataset: crsp.dsf) between July 1st, 2014 and Dec 31st, 2017. (10 pts)
A part of the script is provided. Complete the SQL query based on the information in Question 1.1
In [ ]:
|
#export # Code script for Q 1.1 # Complete the code script below. stmt=""" select permno, from crsp.dsf where permno in {} """.format(tuple(df.loc[df['permno'].notnull(), 'permno'].unique())) df_vol = conn.raw_sql(stmt, date_cols= ['date']) |
In [ ]:
|
#export # the length of the dataframe should be close to 68000 print(len(df_vol)) |
Question 1.2: Compute the past 90-day return volatility. For each stock on each trading day, compute the 90-day volatility (standard deviation) of returns, and generate a new column of df_vol titled vol . Note that the 90 days include the trading day being considered. (5 pts)
For instance, for the stock with a permno 93013 on Dec 28, 2017, the 90-day volatility is the standard deviation of its returns of the most recent 90 days inclusive of Dec 28, 2017.
hint: use groupby() and rolling() function. The answer probably would not take more than 3 lines.
In [ ]:
|
#export # Code script for Q 1.2 # write your code script below. |
Question 1.3: Left merge dataframes df and df_vol based on permno and date, and name the new
dataframe with df. Only Keep the variable vol from df_vol. In other words, the variable ret from df_vol should not appear in the final dataframe. (5 pts)
In [ ]:
|
#export # Code script for Q 1.3 # Write your code script below |
Question 2: Bond Ratings
Some bonds have higher credit ratings, meaning that investors are confident that the bond issuers are able to pay off the bonds when they are due. Some bonds have lower credit ratings, and investors may demand higher
risk compensations, resulting in higher bond yields. In this question, we are going to find out the credit ratings for each bond on each date in our dataframe df.
acf351b_ratings.csv provides historical credit ratings for all bond issues in the spreadsheet.
In [ ]:
|
#export df_rating=pd.read_csv("https://frankxu1987.weebly.com/uploads/6/2/5/8/62583677/acf351b_ratings.csv") df_rating.head(1) |
The variable issue_id is the identifier of bonds. The variable rating_type indicates the rating agencies. MR denotes Moody's Rating, SPR indicates Standard and Poor's Rating, and FR indicates Fitch's Rating. The variable rating_date is the date on which the rating agencies assign their ratings. The variable rating is the bond rating assigned by the rating agency.
Each rating agency has their own rating scales, but they are comparable as follows:
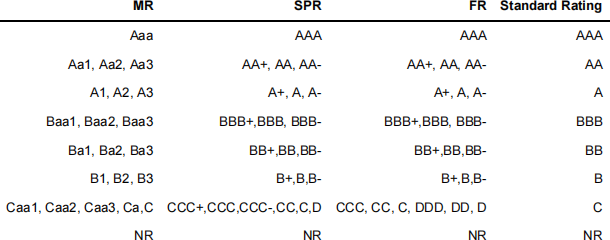
with AAA being the highest credit rating, AA being one tier lower, and so forth. NR indicates Not Rated
Question 2.1: Convert all ratings to standard ratings based on the table above, and generate a new column of df_rating named std_rating . (5 pts)
In [ ]:
#export
# Code script for Q 2.1
# Write your code script below
Question 2.2: Using df_rating_, locate the latest _standard ratings prior to the trade dates (variable
date ) for each bond issue in df_, and generate a new variable named rating in _df. (10 pts)
For example, the bond with an issue id of 647968 was traded on March 31st, 2016, then for this transaction you should try to locate the latest credit rating of the bond prior to March 31st, 2016. If multiple credit rating agencies (S&P, Moody’s and Fitch) rate the bond issue on the same dates , select the LOWEST one.
Hint: Sort the dataframes df and df_rating appropriately. Then use the function pd.merge_asof()
(https://pandas.pydata.org/pandas-docs/version/0.25.0/reference/api/pandas.merge_asof.html). The answer probably would not take more than 5 lines.
In [ ]:
|
#export #Code script for Q 2.2 #Write your code script below |
Question 3: Treasury Yield and Yield Spreads
Bond yields are also affected by macroeconomic fundamentals, esp. U.S. treasury yields. U.S. treasuries are typically assumed to be risk-free, and, thus, the differences between the corporate bond yields and U.S. treasury yields should reflect the credit risk of the bond issuers. In this question, we are going to derive bond yield spreads from bond yields variable yield .
zero_coupon_yld.csv provides historical U.S. treasury yields.
In [ ]:
|
#export df_treasury = pd.read_csv("https://frankxu1987.weebly.com/uploads/6/2/5/8/62583677/zero_coupon_yld.c df_treasury.head(1) |
The variables SVENYXX refer to the U.S. treasury par yields where XX indicates the maturity. For instance, SVENY05 refers the 5-year U.S. treasury par yields.
Question 3.1: Left merge df and df_treasury on date . (5 pts)
Hint: make sure that the date variables are datetime formats in both dataframes.
In [ ]:
|
#export #Code script for Q 3.1 #Write your code script below |
Question 3.2: Compute the difference in years between maturity and date in df, and generate a variable named ttm to represent time to maturity. (5 pts)
For instance, if a bond matures on March 31st, 2025 and the trading date is March 15th, 2016, then the ttm (Time To Maturity) for the bond is 9.04 years.
In [ ]:
|
#export #Code script for Q 3.2 #Write your code script below |
![]()
Question 3.3: For each row in _df_, i.e., for each bond on each trade date in _df_, locate the U.S. treasuries with maturities closest to the bond issues’ ttm(s), and then generate a variable named treasury_yield to represent the treasury yields of the closest maturities. (10 pts)
For example, if a bond is traded on March 15th, 2016 and its time to maturity (ttm) is 9.04 years, then you should locate the par yield of US 9-year (the closest time to maturity) treasury on March 15th, 2016 as the treasury_yield of the bond.
In [ ]:
|
#export #Code script for Q 3.3 #Write your code script below |
Finally, we can compute the bond yield spreads spread
In [ ]:
#export
df['spread']= df['yield']-df['treasury_yield'];
Q4: Winsorization and Outliers
Raw data consists of outliers most of the time, if not all. An outlier (https://en.wikipedia.org/wiki/Outlier) is a data point that differs significantly from other observations. A typical way to deal with outliers is to drop them from analysis. In this section, we will conduct simple winsorization to eliminate potential outliers.
Q4.1 Compute the 1st percentile and 99th percentile values for variables spread and ttm , and PRINT out the final values with print() function. (5 pts)
In [ ]:
|
#export #Code script for Q 4.1 #Write your code script below |
2021-12-30