MTH6134 / MTH6134P: Statistical Modelling II
Hello, dear friend, you can consult us at any time if you have any questions, add WeChat: daixieit
MTH6134/MTH6134P: Statistical Modelling II
Question 1 [23 marks]. Suppose that Yi ~ N(ui . σ2 ) for i = 1. 2. a a a . n, all independent, where ui = B1xi+B2zi , xi and zi are known covariates, and 9 is known.
(a) Write down the likelihood for the data y1. a a a .yn .
(b) Find the maximum likelihood estimators  and
and  of β1 and β2.
(c) Prove that is an unbiased estimator of β1 .
(d) Explain why has a normal distribution.
Question 2 [20 marks]. The numbers of babies surviving to discharge from a hospital (y) out of the number admitted to neonatal intensive care (r) for two epochs (w) and three gestational ages (x), in weeks, were recorded. Below are the data.
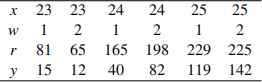
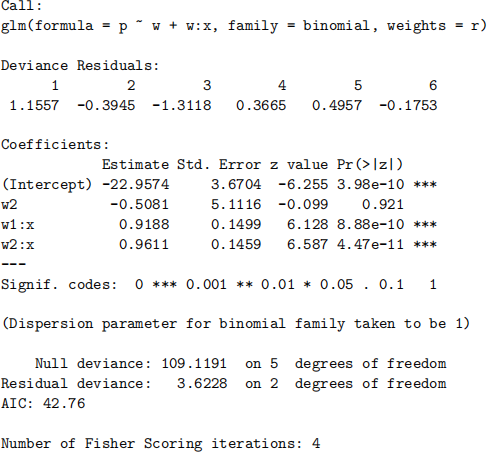
Let Yjk denote the number of babies surviving to discharge out of the rjk of gestational age xk admitted to neonatal intensive care for epoch j. Then it is assumed that Yjk ~ Bin(rjk . 7jk) for j = 1. 2 and k = 1. 2. 3, all independent, where log/7jk/(1 - 7jk)} = aj+Bjxk. This model was fitted to the data using R and the following output was obtained:
|
(a) Plot the proportions of babies surviving to discharge against gestational age by epoch. What are your conclusions? (b) Write down the fitted logistic regression model for each epoch. (c) Use the above output to assess the goodness of fit of the model. (d) Give an approximate 95% confidence interval for β1 - β2 . |
|
Question 3 [22 marks]. Suppose that Yi ~ Bin(ri . 7i) for i = 1. 2. a a a . n, all independent, where the ri are known, log/-log(1 - 7i)} = B0 +B1xi and xi is a known covariate.
(a) Explain why this is a generalised linear model.
(b) Find the Fisher information matrix.
(c) Obtain the asymptotic distribution of the maximum likelihood estimator ![]() 1 of B1 .
1 of B1 .
(d) State the form of an approximate test for testing H0 : B1 = 0 against H1 : B1 ![]() 0.
0.
Question 4 [23 marks]. A study of 49 attending physicians and 71 surgical residents in training at a university hospital was carried out to investigate whether the two groups of surgeons were applying unnecessary blood transfusions at different rates. For each surgeon, the number of blood transfusions prescribed unnecessarily in one year was recorded. The contingency table below summarises the data.
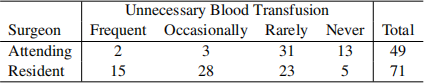
Let Yjk denote the number of surgeons classified in row j and column k. Then it is assumed that the Yjk for row j have a multinomial distribution with parameters yj a and θjk for j = 1. 2 and k = 1. 2. 3. 4, and that the rows are independent, where yj a = 〉k(4)= 1 yjk and θjk is the probability that a surgeon is classified in row j and column k. The null hypothesis is that the distributions of unnecessary blood transfusions are the same for the two groups of surgeons.
|
(a) Briefly explain how you would enter these data into R. What commands would you use to fit a log-linear model to the data? (b) Explain why, under the null hypothesis, the expected frequency for cell (j . k) is ejk = yj ayak/n, where n = 120. (c) Obtain the expected values under the null hypothesis. Compare these with the observed values. |
|
(d) Find the deviance and the value of Pearson’s goodness-of-fit test statistic. What is your
conclusion about the numbers of unnecessary blood transfusions for the two groups of surgeons?
Question 5 [12 marks]. Suppose that Ti ~ Exp(Ai) for i = 1. 2. a a a . n, all independent, where Ai = Bxi and xi is a known covariate.
(a) Explain what link is being used here.
(b) Write down the likelihood for the data (ti . 8i) for i = 1. 2. a a a . n, where 8i is a censoring variable.
(c) Show that the maximum likelihood estimator of B is ![]() = 〉
= 〉![]() 1 8i/〉
1 8i/〉![]() 1 xiTi.
1 xiTi.
(d) Now assume that there is no censoring. Given that the vectors t and x in R contain the times and the covariate values, what commands would you use to obtain the details of the fitted model?
2021-12-29