iOS App Development CovidStats Assignment
Deliver a modified version of the provided project that meets the specification that follows. General functionality is described below. More specific user interface design requirements are shown via two screenshots and some additional design metrics on pages 2 and 3. The model and test data for this assignment are being provided for you. Additionally the RightRoundedRectangle shape is being provided as well.
General Functionality: The major views in the application should be presented by a NavigationView. The data should be provided by a view model class named CountryStatsViewModel. It should hold the test data and the boolean value representing if the app is showing all countries or only watched countries.
CountryList: You will create a SwiftUI view named CountryList which will be the first view presented in the navigation view. It should be a list that is split into two sections in a grouped list style. The first section contains a toggle that will change the second section so that it is showing all of the countries in the test data or so that it is showing only the countries in the test data that have an isWatched value of true. The second section will show the appropriate countries based on the toggle using a custom SwiftUI view named CountryCell. Tapping one of the cells in the second section should navigate to the country detail view. This view should have a navigation bar title of “Covid19 Stats”.
CountryCell: This SwiftUI view will show a brief summary of the country data for each country in the country list. It should present the flagEmoji for the country on the leading side following by the country name and total cases confirmed stacked vertically on the trailing side.
CountryDetail: The country details will be presented using this view, which will be presented by the navigation view when a user taps a country cell in the country list. This view should have its navigation bar title set to the countries name. It should also have a trailing navigation bar button that toggles the countries isWatched value when tapped. This view should have the following elements vertically aligned:- A large horizontally centered country flag emoji
- A horizontal bar graph showing the total and new confirmed case values
- A total confirmed cases text caption
- A horizontal bar graph showing the total and new recovered values
- A total recovered text caption
- A horizontal bar graph showing the total and new death values
- A total deaths text caption
TwoValueBarGraph: This view will be responsible for drawing one bar graph from the country detail view (i.e., it will draw one bar and be used in the country detail view three times). It should draw a bar from the leading edge to the trailing edge showing the total count with the new count being drawn in a different color. It can utilize the provided
RightRoundedRectangle shape to create shape as specified below.
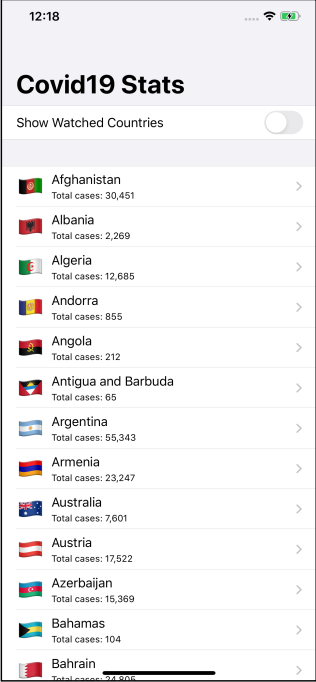
- The navigation bar title should be “Covid19 Stats”
- The flag emoji should use the largeTitle font
- The country name text should use the body font
- The total cases text should have a text format similar to what is shown in the screenshot to the left
- The total cases text should use the caption font and have a top padding of 4
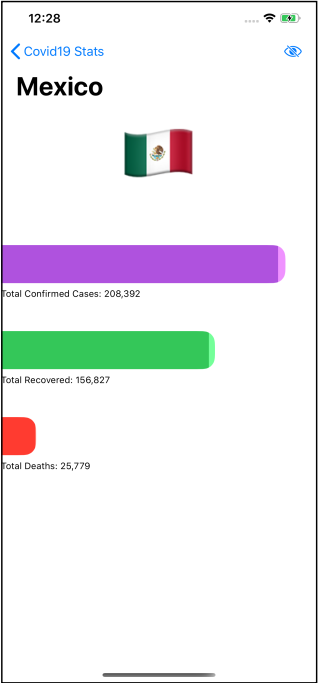
- The navigation bar title should be the name of the selected country
- The trailing navigation bar item should be a button that toggles the countries isWatched value; its label should be an image with the system name “eye" when isWatched is true and “eye.slash" when isWatched is false
- The flag emoji should use a font with system size 100 and be horizontally centered
- The bar graphs should be relatively sized (i.e., if bar with the total value 100 was 100 points wide, another bar with total value 50 would be 50 points wide)
- The bar graphs should be 50 points in height
- The largest bar graph should take up 90% of the width of the screen
- The right side of the bar should have rounded corners with a corner radius of 16
- Each bar graph should show the total value with the section representing the new value drawn in the same color but with a brightness modifier of 0.25 applied
- The confirmed cases bar graph should be Color.purple, the recovered bar graph should be Color.green, and the deaths bar graph should be Color.red
- The caption text below each bar graph should use a text format similar to what is shown in the screenshot to the left
- The caption text below each bar graph should use the caption font
- The caption text should have a leading padding of 8 points
- There should be vertical padding of 32 points between the caption text and the next bar graph
2020-07-01