BU.510.650 – Data Analytics, Sample Questions
Hello, dear friend, you can consult us at any time if you have any questions, add WeChat: daixieit
BU.510.650 – Data Analytics, Sample Questions
Note: This document is not meant to reflect the length or distribution of topics for the actual
exam. Its goal is to familiarize you with the exam style.
1. For each statement below, choose True or False.
(a) All model selection methods (best subset selection, forward selection, and backward selection) lead
to the same set of input variables (predictors).
TRUE FALSE
(b) Adding an input variable (predictor) to a linear regression will never reduce R2 .
TRUE FALSE
(c) Adding an input variable (predictor) to a linear regression will never reduce the adjusted R2 . TRUE FALSE
2. We run linear regression for Revenue (as the output variable (response), in million $) and Salesforce (as the input variable (predictor)) based on training data in the previous 200 periods (weeks). The following is part of the summary output of this linear regression.
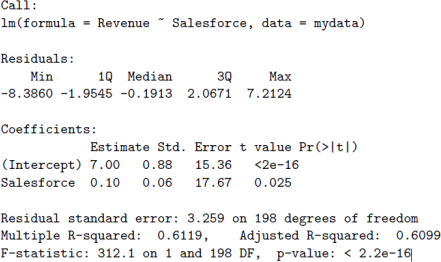
Answer the following questions based on the above summary output.
(a) What proportion of variation in the training data is explained by the linear regression model?
(b) Is the coefficient of Salesforce significantly different from zero? Explain your answer.
(c) In the next two weeks, we want to change the Salesforce level to 25 and 30, respectively. Predict the corresponding revenues based on the above regression output.
(d) Suppose that we introduce Advertising as an input variable (predictor) in this regression. Answer the following questions.
i. Will the new model fit the training data better? (If yes, explain how you would verify it from the output. If no, explain why not.)
ii. Will the new model yield higher prediction accuracy for the test data? (If yes, explain how you would verify it from the output. If no, explain why not.)
3. The College data set provides data about 18 variables (columns) for more than 700 colleges (observations). The following table shows some of the columns for the first three rows of this data set:
|
|
Private |
Apps |
Accept |
Enroll |
… |
Expend |
Grad.Rate |
|
Abilene Christian University |
Yes |
1660 |
1232 |
721 |
... |
7041 |
60 |
|
Adelphi University |
Yes |
2186 |
1924 |
512 |
… |
10527 |
56 |
|
Adrian College |
Yes |
1428 |
1097 |
336 |
… |
8735 |
54 |
We would like to model Apps (which indicates the number of applications) as the output variable
(response) as a linear function of all others as the input variables (predictors). To determine the best subset of predictors, we use best subset selection. Part of the code and a partial output is shown below:
regfit.best=regsubsets(Apps~., data=College, nvmax=17)
summary(regfit.best)
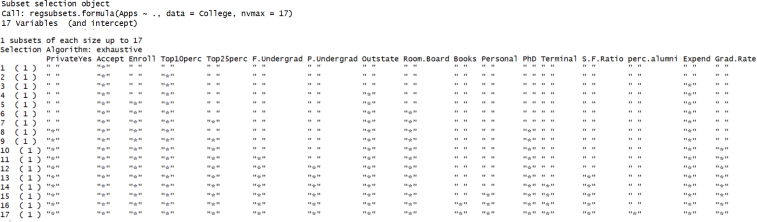
best.summary=summary(regfit.best)
best.summary$cp

Answer the following questions based on the above information.
(a) Which predictors are included in the best model with 5 predictors?
(b) How many predictors are there in the best model according to Cp criterion?
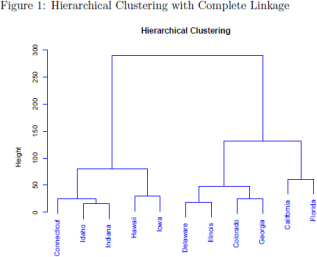
4. Suppose that we have data about arrests in 11 US states, and we want to separate the observations
into three clusters. (Notice that each state is an observation.) After running the hierarchical clustering, we obtain the dendrogram shown in Figure 1. If we cut the tree to obtain three clusters, what are the clusters we would obtain? That is, write the observations (i.e., state names) for each cluster.
5. Suppose we have loan data, which includes the borrowed amount (in 000s of dollars, denoted by
X1), borrower’s annual income (in 000s of dollars, denoted by X2), whether or not the borrower is a student (X3, which is 1 if the borrower is a student and 0 otherwise), and whether or not the borrower defaulted (Y, which is 1 if the borrower defaulted and 0 otherwise). We want to predict the probability that a borrower will default. After running the logistic regression, we obtain the
coefficients: 
(a) Suppose that Shengqi, who is a student, borrowed $5000 (X1 = 5) and has an annual income of
$25,000 (X2 = 25). Estimate the probability that he will default. (Please show enough of your work to clarify your reasoning.)
(b) Determine the odds that Shengqi will default.
6. Consider the following data, which shows the types of smart phones available at a store. (AboveMed
is 1 if the phone’s price is above median, and 0 otherwise.) Suppose this data is stored as a data frame called Phone. In the rest of this question, you will be asked about the result of certain R commands applied to this data frame. The *grey cells* (Memory, Size, Price, MedianPrice, Available, A, B. C, D, E, F) are *not part of the data* – they are just column names and row names.
|
|
Memory |
Size |
Price |
AboveMed |
Available |
|
A |
32 |
Regular |
650 |
0 |
0 |
|
B |
128 |
Regular |
750 |
0 |
1 |
|
C |
256 |
Regular |
850 |
1 |
1 |
|
D |
32 |
Plus |
770 |
0 |
1 |
|
E |
128 |
Plus |
870 |
1 |
1 |
|
F |
256 |
Plus |
970 |
1 |
0 |
For each R command below, please write down the result (you do not have to display the output just as R would; simply indicate the result you would obtain):
(a) > Phone[2,3]
(b) > Phone[1,]
(c) > Phone[Phone$Available==0,]
(d) > table(Phone$AboveMed, Phone$Available)
What you see below is a series of R commands (along with the output they produced as they were executed). Indicate the output you would obtain from the last command.
(e) > x = seq(from = 1, to = 9, by = 2)
> y = 2
> x*y
(f) > set.seed(19)
> sample(1:15,2)
[1] 2 7
> set.seed(19)
> sample(1:15,2)
2021-12-20