Computational Finance – HW 1
Hello, dear friend, you can consult us at any time if you have any questions, add WeChat: daixieit
Computational Finance – HW 1
Complete the following problems in your home work groups. All calculations must be done in MATLAB. When the question tells you to report or output an answer, your code must print it using the disp or fprintf functions. When the question tells you to plot something, your code must produce a MATLAB figure. When the question asks you to describe something or compare, you need to answer it in your own words. Type your answer as a comment in your code file. See the Sample Homework on Blackboard as a template. I recommend starting each script file with commands to close all figures, clear the workspace, and clear the command window: close all; clc; clear;
Additionally, please upload your “.m” script files with your assignment submission.
1. In your Investments class, you studied or are studying the Capital Asset Pricing Model. You learned that given a set of assets, for a given return there is a portfolio that attains that return with minimum risk. The set of all such portfolios is called an efficient frontier. You also learned that an investor can maximize her return per unit of risk by holding a portfolio on the Capital Market line (CML) – the steepest line that starts at the risk-free portfolio and makes contact with the efficient frontier. The slope of this line is called the Sharpe Ratio and the point at which it touches (is tangent to) the efficient frontier is known as the tangency portfolio.
In this exercise, you will calculate the risk and return of two assets, construct the efficient frontier, find the tangency portfolio, and plot the CML.
Consider two assets A and B. You have observed their prices at the ends of 6 consecutive months. You also know that rate of return on a risk-free investment is 2.2%.
|
Asset |
Month 1 |
Month 2 |
Month 3 |
Month 4 |
Month 5 |
Month 6 |
|
A |
22.00 |
22.97 |
23.01 |
23.46 |
24.88 |
24.65 |
|
B |
116.10 |
123.26 |
131.68 |
126.62 |
131.30 |
132.25 |
a. Store these asset prices in a 2 x 6 matrix. Calculate returns for each asset and store your result in a 2 x 5 matrix.
Recall, the return on asset over a given period is its price at the end of the period, minus its price at the beginning of the period, divided by its price at the beginning of the period.
Compute the mean and standard deviation (volatility) of each asset’s return and store your results in two 2x1 vectors, one for means and one for volatilities. Compute the correlation between the asset returns using MATLAB’s corr() function. Use the documentation to figure out how to use it.
b. We will now construct long-only portfolios of assets A and B. Define a vector of portfolio weights of Asset A starting at 0 and going to 1 in increments of 0.0001. A’s portfolio weight is the fraction of your money that you allocate to Asset A, with the remainder going to Asset B. Calculate the expected return and volatility of portfolios containing assets A and B for each
weight. Store your answers in two vectors – one for expected returns, and one for volatilities. Hint: recall from statistics that for any two constants a and b and random variables X and Y:
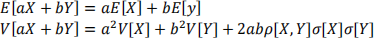
Where E[] denotes expected value, V[] denotes variance, ![]() [] denotes standard deviation, and
[] denotes standard deviation, and ![]() [] denotes correlation.
[] denotes correlation.
c. Find the tangency portfolio and report its portfolio weights on Assets A and B, its expected return, and its volatility. Use MATLAB to do this. Don’t just look at the graph.
Hint: recall from calculus that a line is tangent to a curve at the point where the curve has the same slope as the line. For each point on the efficient frontier, approximate its slope using the change in E[R] over the change in sd[R], and compare it to the slope of the line connecting the risk-free portfolio to that point on the efficient frontier. The point at which the slopes are closest to each other is (approximately) the tangency portfolio.
d. Plot the efficient frontier, the capital market line, and a dot for the tangency portfolio on the same plot. Label your axes, include a legend, and give your plot a title.
Hint: If you were not able to calculate the tangency portfolio, you can plot the efficient frontier, eyeball what you think the tangency portfolio is, and use your eyeballed values to plot the CML for partial credit.
e. If an investor wanted to attain an expected return of 2.55%, would she need to buy the risk- free asset or borrow at the risk-free rate? Explain your answer using the graph from Part (d).
2021-12-17