STA215: Fall 2021 Sample Final Exam
Hello, dear friend, you can consult us at any time if you have any questions, add WeChat: daixieit
STA215: Fall 2021
Sample Final Exam
Instructions: Amongst 2 parts, there are 25 questions worth a total of 65 marks. In Part A, there are 20 multiple choice worth 2 marks each; choose the best answer. In Part B, here are 5 long answer worth a total of 25 marks; show all your work. Unless otherwise indicated, you should use R for calculations, etc.
1 Part A: Multiple Choice
Question 1: Which of the following variables is not categorical and ordinal?
(a) Education level (highschool, Bachelor’s Degree, Master’s, Phd, etc)
(b) Area code (289, 905, 204, 647, etc)
(c) Weight class of a professional boxer (lightweight, middleweight, heavyweight)
(d) Colour of medal won by an athlete (Gold, Silver, Bronze) (e) Coffee size (Small, Medium, Large, Extra Large)
Question 2: An individual is worried about their budget and so records how much money he spends per week on eating out over a period of 24 weeks and the observations (roundest to the nearest $) are shown below:
12 8 26 44 5 20 62 10 18 24 38 14
22 29 35 13 12 24 4 28 12 18 21 23
Found by hand, he five number summary for these observations is:
4 12 21 27 62
If we created an outlier boxplot for this data set, the lines coming out from the box (i.e., the whiskers) would extend to which values?
(a) 4 and 62
(b) 5 and 62
(c) 5 and 44
(d) 4 and 44
(e) 4 and 62
Question 3: At a small local university, suppose there are five faculties: Science, Psychology, Engineering, Sociology and Arts. There are 135 professors in total as follows:

(a) Yes, because each professor in the population of 135 professors had an equal chance of being selected.The president of the university would like a sample of 45 professors across the five faculties and so randomly selects 15 science professors, 10 psychology professors, 10 engineering professors, 5 sociology professors and 5 arts professors. Is the sample of 45 professors a simple random sample of all the professors at the university?
(b) No, because each professor in the population of 135 professors did not have an equal chance of being selected.
(c) No, because the population consisted of professors in five different faculties.
(d) Yes, because professors from every faculty were equally represented in the sample.
(e) No, because not every possible sample of 45 professors had an equal chance of being selected.
The next two questions (4 and 5) refer to the following:
The following frequency distribution table displays the ages of individuals working out at a gym one day:
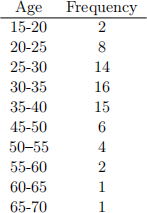
Question 4: The distribution of ages is:
(a) skewed to the right and so the median is likely greater than the median
(b) skewed to the left and so the median is likely greater than the mean.
(c) skewed to the right and so the median is likely less than the mean.
(d) skewed to the left and so the median is likely less than the mean.
(e) approximately symmetric and so the median and mean are approximately equal. Question 5: Which interval contains the third quartile of ages?
(a) 20-25
(b) 25-30
(c) 30-35
(d) 35-40
(e) 45-50
Question 6: Suppose a market research firm conducted a survey about rewards programs, and in particular, those tied to gas stations. Pretend that below is a summary of some of the information collected on the survey participants:
● 20% have a Petro-Points account
● 28% have a Journie rewards account
● 26% have an Esso Extra rewards account
● 7% have both a Petro-Points and a Journie rewards account
● 10% have both a Petro-Points and an Esso Extra rewards account
● 72% don’t have a Journie rewards account
● 3% have all three
● 44% have none
What proportion of survey participants have a Journie rewards and Esso Extra rewards but not a Petro- Points account?
(a) 0.15
(b) 0.04
(c) 0.01
(d) 0.44
(e) 0.07
Question 7: A company that produces fine crystal knows from experience that 10% of its goblets have cosmetic flaws and must be classified as “seconds". Among six randomly selected goblets, how likely is it that less than 2 are seconds?
(a) 0.88
(b) 0.01
(c) 0.35
(d) 0.98
(e) 0.09
Question 8: Two quantitative variables X and Y are measured on a sample of five individuals. Con- sider the following (incomplete) table of values for this data set.
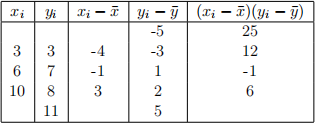
The means and standard deviations of the two samples are ![]() =7, y¯=6, sX=5 and sY =4.
=7, y¯=6, sX=5 and sY =4.
What is the sample correlation between X and Y?
(a) 0.9650
(b) 0.9775
(c) 0.9625
(d) 0.9850
(e) 0.9575
Question 9: An arborist is studying a certain species of tree. It is believed that a tree’s age can be estimated based on its girth. The arborist measures the girth of a sample of trees for which she knows the ages. The correlation between the two variables is found to be 0.82 and the equation of the least squares regression line is found to be yˆ = 0.05 + 2.47x. Which of the following statements is true?
(a) 67% of the variation in age can be accounted for by its regression on girth.
(b) 82% of the variation in girth can be accounted for by its regression on age.
(c) 82% of the variation in age can be accounted for by its regression on girth.
(d) 92% of the variation in girth can be accounted for by its regression on age.
(e) 67% of the variation in girth can be accounted for by its regression on age.
Question 10: A variable X has a distribution which is described by the following density curve:
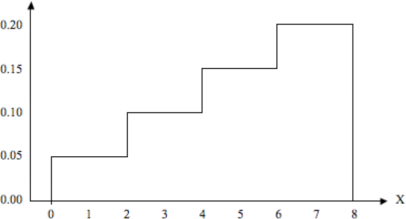
What proportion of values of X fall between 2 and 5?
(a) 0.250
(b) 0.350
(c) 0.475
(d) 0.425
(e) 0.450
Question 11: Students compete to go to a provincial math competition. Teachers have the students write a test and students who score in the top 25% get to go to the math competition. sSuppose the teachers know that the test scores are normally distributed with mean 82% and standard deviation 3%. What must a student score in order to be sent to the provincial competition?
(a) 67.45%
(b) 84.02%
(c) 79.98%
(d) 90.15%
(e) 88.26%
Question 12: Suppose heights of gymnasts aged 10-12 at a local club are normally distributed with mean 56 inches with a standard deviation of 1.5 inches. If a random sample of 10 such gymnasts is selected, what is the probability their mean height is more than 55 inches?
(a) 0.9825
(b) 0.2525
(c) 0.7475
(d) 0.6915
(e) 0.0175
Question 13: Consider the hypothesws:
H0 : µ = 2 versus Ha : µ > 2.
Based on a sample of size 15, the test statistic is found to be t = 2.25. Which two correspond to the p-value using R and the t-table:
(a)  , between 0.02 and 0.025
(b)  , between 0.01 and 0.02
(c)  , between 0.95 and 0.975
(d)  , between 0.025 and 0.05
(e)  , between 0.975 and 0.98
Question 14: Consider an unfair coin that lands on Heads 63% of the time and lands on Tails 37% of the time. If the coin is tossed 100 times, what is the approximate probability that it lands on Heads between 70 and 90 times inclusive?
(a) 0.2672
(b) 0.9825
(c) 0.7328
(d) 0.0735
(e) 0.0175
Question 15: City engineers in Hamilton, Ontario would like to estimate the true mean commuting distance of all workers in the city between home and their principal place of business. They calculate that, in order to estimate this mean to within ±1 kilometre with 99% confidence, they require a sample of 120 workers. What sample size would be required to estimate the true mean commuting distance for all workers in Hamilton to within ±2 kilometres with 99% confidence?
(a) 30
(b) 60
(c) 85
(d) 240
(e) 480
Question 16: A large factory produces paint. Before shipping out orders of the paint, the quality inspector wants to ensure the cans of paint have been properly filled. The labels on the cans say 1 gallon. The fill volumes are in fact known to be normally distributed with a standard deviation of 0.02 gallon. A random sample of 40 cans of such paint is selected and their mean volume is 0.98 gallon and their standard deviation is 0.03 gallon. What is the value of the test statistic for the appropriate test of significance?
(a) z=-6.32
(b) t=-6.32
(c) z=-4.22
(d) t=-4.22
(e) t=-0.67
The next three questions (17 , 18 and 19) refer to the following:
Tim Hortons and Starbucks are two of the most popular coffee shops in Canada. The question is-do Canadians prefer one over the other? To answer this, a matched pairs experiment was conducted as follows. The researchers collected 25 volunteers to participate in a blind taste test. Each volunteer tasted a cup of coffee from Tim Hortons and a cup of coffee from Starbucks (in random order) and assigned a score on a scale from 0 to 100. Based on the scores, below is some information collected:

Question 17: Which of the following statements is/are true?
(I) The scores for Tim Hortons and Starbucks for each individual are independent. (II) The scores for Tim Hortons and Starbucks for each individual are dependent.
(III) In order to conduct the matched pairs t test, we must assume that scores for Tim Hortons and scores
for Starbucks both follow normal distributions.
(IV) In order to conduct the matched pairs t test, we must assume that differences in scores (Tim Hortons-
Starbucks) follow a normal distribution.
(a) I only
(b) I and III
I and IV
II and III
II and IV
Question 18: What are the hypotheses for the appropriate test of significance?
(a) H0 : µd = 0 vs. Ha : µd < 0
(b) H0 : ![]() d = 0 vs. Ha :
d = 0 vs. Ha : ![]() d = 0
d = 0
(c) H0 : µT = µS vs. Ha : µT < µS
(d) H0 : ![]() d = 0 vs. Ha :
d = 0 vs. Ha : ![]() d < 0
d < 0
(e) H0 : µd = 0 vs. Ha : µd ![]() 0
0
Question 19: Assuming the appropriate assumptions are satisfied, what is the value of the test statistic for the appropriate test of significance?
(a) 0.27
(b) 1.36
(c) 6.82
(d) 2.47
(e) 3.15
Question 20: A sample of five Major League Baseball games has a mean duration of 168 minutes and a standard deviation of 17 minutes. Game durations are known to follow a normal distribution. A 90% confidence interval for the true mean duration of all Major League baseball games is:
(a) (155.49, 180.51)
(b) (154.18, 181.82)
(c) (153.10, 182.90)
(d) (152.68, 183.32)
(e) (151.79,184.21)
![]() 2 Part B: Long Answer
2 Part B: Long Answer
Question 21: Consider the sample space S = {1, 2, 3, 4} where all outcomes are equally likely. Let A = {1, 4}, B = {2, 4} and C = {3, 4}. Are A and B independent? B and C? A and C? Show all your work. (3 marks)
Question 22: We would like to determine how a person’s cholesterol level can be predicted by his or her fat consumption. The average daily fat consumption (in grams) and the cholesterol levels for a sample of eight individuals are shown below:

(a) Create a scatterplot of the data and comment on the relationship.
(b) Find the equation of the least squares regression line for predicting cholesterol level from fat con- sumption and draw the line on the scatterplot.
(c) Provide an interpretation of the slope of the least squares regression line.
(d) Calculate the value of the residual for Individual 2.
(5 marks)
Question 23: The pH levels of 14 samples of water selected from random locations in a large lake are shown below:
6.82 6.55 7.04 6.88 6.73 7.16 6.80 6.63 7.10 6.75 7.09 6.46 6.92 6.71
The mean and standard deviation of pH levels for these 14 samples are calculated to be 6.8314 and 0.2132, respectively. pH levels in the lake are known to follow a normal distribution.
(a) Writing out all five steps, conduct a formal hypothesis test at the 5% level of significance to de-
termine whether the true mean pH level in the lake is less than 7.0. You make use R for simple calculations/probabilities.
(b) Verify your result in (a) by using an appropriate function in R; do make sure to identify and interpret
the key elements of the R output.
(5 marks)
Question 24: We measure the fuel efficiences (in mpg) of samples of cars for brands of automobile. The data are shown below with some summary statistics:
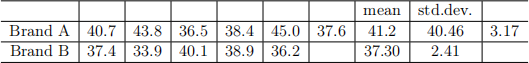
What is the estimate of the common variance of fuel efficiencies for the two brands of automobile?Assume that fuel efficiencies for both brands are known to follow normal distributions.
(b) Calculate a 99% confidence interval for the difference in the mean fuel efficiency for the two brands of automobile
(c) By hand, conduct an appropriate test of significance at the 1% level of significance to deter- mine whether the mean fuel efficiency for Brand A is greater than that for Brand B. Use the p-value method and show all your steps. You may use R for your calculations.
(d) Interpret the p-value of the test found in (c).
(e) If instead you had used the rejection region approach, what would have been the rejection region? (7 marks)
Question 25: 5. We take random samples of ten men and eight women and record the number of calories they consume on a particular day. The data are shown in the table below

(b) Verify your result in (c) by using an appropriate function in R; do make sure to identify and interpret
the key elements in the R output.
(5 marks)
2021-12-15