Stat 33B, Fall 2021 HW4: Conditionals and Iterations
Hello, dear friend, you can consult us at any time if you have any questions, add WeChat: daixieit
HW4: Conditionals and Iterations
Stat 33B, Fall 2021
Introduction
The purpose of this assignment is to work with conditional statements, as well as iterations (loops).
General Instructions
• Write your narrative and code in an Rmd (R markdown) file.
• Name this file as hw4-first-last.Rmd, where first and last are your first and last names (e.g. hw4-gaston-sanchez.Rmd).
• Please do not use code chunk options such as: echo = FALSE, eval = FALSE, results = 'hide '. All chunks must be visible and evaluated.
Problems in the next page
1) Data: Weekly California Gasoline Prices
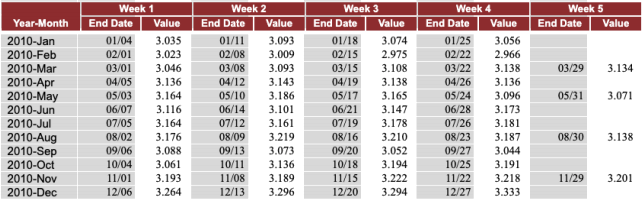
The data set for this problem has to do with weekly gasoline prices in California between 2010 and 2020, as they are reported by the U.S. Energy Information Administration (EIA).
https://www.eia.gov/dnav/pet/hist/LeafHandler.ashx?n=pet&s=emm_epm0_pte_sca_
The image below is a screen-capture showing the data set—as it appears in the EIA website— for the Weekly California All Grades All Formulations Retail Gasoline Prices (Dollars per Gallon) during 2010.
Data raw-gas-prices-2010-2020.csv
You can find the associated CSV file raw-gas-prices-2010-2020.csv in the folder contain- ing this pdf of instructions (see bCourses).
The data table in the CSV file has 11 columns (first six rows shown below):
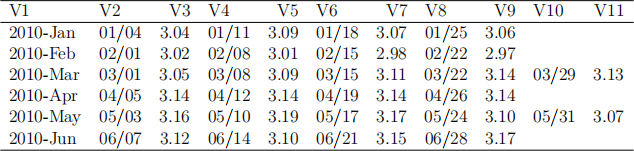
Table 1: First six rows of weekly gas prices
• V1 corresponds to the year and month name
• V2, V4, . . . , V10 contain the starting day/month of the week (some months have 4 weeks, and others have 5 weeks)
• V3, V5, . . . , V11 contain the weekly gas prices
1.1) Produce a Tidy Version of the Data
The goal in this problem is to get a tidy version of the data set. To accomplish this task, you will have to “reshape” the raw data set and create a new table with a simpler and nicer structure . . . without using functions from any tidyverse package. In other words, you can only use base functions and loops.
• Download a copy of the file raw-gas-prices-2010-2020.csv.
• Write code to generate a data frame gas_data containing three variables:
– year_month
– end_date
– price
• The data frame gas_data should contain no missing values or blank cells.
• Display the head(), tail(), dim(), and str() of your data frame clean_gas.
• Here is how the first rows of the new table should look like:
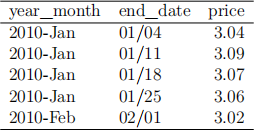
Table 2: First five rows of weekly gas prices
2) Distance Matrix of Letters
The following code generates a random matrix distances with arbitrary distance values
# random distance matrix
num_letters <- length(LETTERS)
set.seed(321)
values <- sample.int(num_letters)
distances <- values %*% t(values)
diag(distances) <- 0
dimnames(distances) <- list(LETTERS, LETTERS)
The first 5 rows and columns of distances are:
distances[1 :5 , 1 :5]
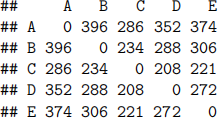
Consider the following character vector vec <- c( 'E' , 'D ' , 'A '). The idea is to use the values in matrix distances to compute the total distance between the letters: that is from E to D, and then from D to A:
# (E to D) + (D to A)
272 + 352
## [1] 624
Hence, you can say that the letters in the word 'E' 'D ' 'A ' have a total distance value of
75.
2.1) Computing Distances: with a character vector
Consider the matrix distances defined above, and assume you also have a character vector with upper case letters, e.g. ltrs = c( 'E' , 'D ' , 'A ')
Write R code (using loops) to compute the total distance between the letters of a given character vector. For example, you can use the following input vector and calculate the total distance among its letters:
• stats <- c( 'S ' , 'T ' , 'A ' , 'T ' , 'S ')
2.2) Computing Distances: with a list of character vectors
To make things more interesting, consider the following list strings
# use your own 'first ' and ' last ' objects
strings <- list(
oski = c ( 'O ' , 'S ' , 'K ' , 'I'),
bear = c ( 'B ' , 'E' , 'A ' , 'R'),
berk = c ( 'B ' , 'E' , 'R' , 'K ' , 'E' , 'L ' , 'E' , 'Y'),
lets = rev (LETTERS),
first = c ( 'G ' , 'A ' , 'S ' , 'T ' , 'O ' , 'N'), # use your first name!
last = c ( 'S ' , 'A ' , 'N ' , 'C ' , 'H' , 'E' , 'Z ') # use your last name! )
Write a for() loop to iterate over the elements in strings, and compute their distances. At each iteration, store the calculated distances in a list called strings_dists; this list should have the same names as strings.
3) Mean and Variance
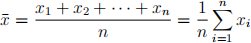
Consider a quantitative variable X with n values:
As you may know, the mean of X, denoted ![]() , is given by:
, is given by:
In turn, the variance of X, denoted Vx, is given by:

R comes with the functions sum(), mean(), and var(). For this problem, however, you are not allowed to use these functions.
Write code to compute the mean and the variance of the vector x = c(2, 3, NA, 5, NA, 7, 8). With this vector, implement your code in a way that missing values are not taken into account.
You are allowed to use length(), if-else statements, for() or while() loop, as well any arithmetic operator: see ?Arithmetic. Also, you can use is.na() only on a single element of x; likewise you can use the next statement (inside loops).
BTW: You don’t need to write a function. We haven’t covered this topic yet, so we don’t expect that you know the syntax for writing functions.
2021-12-15