DSCI 216: Stochastic Computing
Hello, dear friend, you can consult us at any time if you have any questions, add WeChat: daixieit
DSCI 216: Stochastic Computing
Fall 2021
Final Project
Goal
The purpose of this project is for you to gain experience with inference on an open-ended modeling task. This assignment will require you to think, analyze, and plan your solution. Invest the time in thinking about the problem specification. You have all of the tools needed to devise a solution for the problem successfully. This will be a group (2 person) project. Should you elect not to participate in a group, you are still responsible for a complete project solution.
Assignment
In this assignment, you will model an open ended scenario and use provided data to answer questions about a system involving stochastic components. As the goal of a model is to provide the characteristics or behaviors for a simulation that mimics a target system, a key consideration includes deciding upon what components of the system are represented. This choice is entirely up to you. A nontrivial model may include multiple sources of uncertainty.
For this problem, you are given a data set, and are not told what is the population distribution responsible for the data. Moreover, you do not know what are the ground truth parameters governing the underlying population distribution. Your project goals will include determining what is the most suitable model for the data and to use estimators for the unknown population parameters. You will use your estimators to sample from your model and answer questions, i.e. to perform inference.
Problem Specification: Modeling in Agriculture
A farmer has instrumented a field with sensors that measure temperature and wind speed. These sensors take measurements every 10 minutes continuously during the months of June, July, and August during the height of the growing season. The farmer has collected this data from the previous year and will use the data to forecast how much will be spent on water for irrigation of crops.
The data set consists of a measurement of temperature (degrees Fahrenheit) and wind speed (miles per hour) for each time step covering the months of June, July, and August. The farmer’s water costs for irrigation are based on two factors. Whenever the temperature is
above 85° and the windspeed is above 10mph, due to evaporation, the farmer’s water cost doubles because twice as much water is used. The farmer’s baseline water consumption is 10,000 gallons and pays a rate of $8.00 per 1,000 gallons. If able to model water consumption, the farmer can better anticipate how much money is needed as a line of credit from the bank in order to satisfy the irrigation needs for the upcoming growing season.
Throughout the summer, if it rains, the farmer does not irrigate that day. Fortunately from data collected during last year’s growing season, the farmer knows that if it is sunny today, there is an 82% chance that it will be sunny tomorrow. Additionally, the farmer knows that if it is rainy today, there is a 30% chance that it will be rainy tomorrow. You will employ this information in your model.
Your tasks will consist of
1. Visualize the data and choose an appropriate modeling distribution. You must include your visualization, analysis, and your rationale for your choice of what is the best modeling distribution.
2. Mathematically formulate and derive mathematical expressions for the MLE estimator(s) for parameters for your modeling distribution.
3. Implement MATLAB code that calculates your estimators using the data set provided.
4. Sample from your model distribution using your estimators.
5. Compare samples from your model distribution with the data set given to you. This comparison will help you determine your model components. You must analyze and discuss these differences.
6. Using the problem specification, develop an approach for inference. This will require you to use samples from your model distribution along with other calculations based on weather information.
The Data
The data set agricultureData .csv contains a single sample on in each row (Figure 1). The first column is the time-step. This column contains a number (1,2,3,…) representing time step t1, t2, …, etc. The second column is the temperature (in degrees Farenheit) measured at time step t1, t2, t3,…,etc. The third column is the wind speed (in miles per hour) measured at time step t1, t2, t3, …, etc.
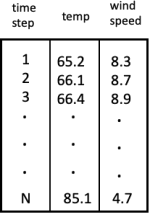
Figure 1. Data
Answer the following questions in written form (PDF or MS-Word) in addition to steps 1-6 above
1. What are the farmer’s water costs for the month of June, July, August without weather information?
2. Assuming uniform distribution over initial weather state (sunny, rainy) on the first day of June, what are the farmer’s water costs for the month of June, July, August including weather information?
3. If the initial weather state p(sunny) on the first day of June changes in 10% increments, what is the impact on water cost? A graph is a good way to support your answer.
Submission
• Create a folder FirstName_LastName in which all of your work will be placed
• Include your visualizations, description of your analyses, and choice of model in a single document (MS-Word or PDF)
• Include your derivation of estimators in a single document (MS-Word or PDF)
• Include discussion of your approach to describing weather information in a single document (MS-Word or PDF).
• Include your answers to the three questions.
• In a single document (MS-Word or PDF), Include your derivations of the MLEs for the and answers to the three questions
• Include all of your MATLAB code. It must be obvious how to run your MATLAB code.
• Create a single ZIP archive file (no TAR, RAR, 7-ZIP, etc.) containing all of your written work and all of your MATLAB code. Make sure to test your MATLAB code by unzipping the ZIP file and verifying that it runs. Code that does not run will receive a zero without review. Please name your ZIP file FirstName_LastName.zip.
• Submit your ZIP file via the Course Moodle site. Make sure to attach the ZIP file before you submit. If multiple submissions are made, only the latest one will be graded.
• Include a copy of your presentation slides
Submit your assignment on time via Moodle
This is a timed submission, so please ensure you have submitted on time. PDF or MS-Word documents are the only form of document that will be accepted. ZIP file is the only archive format that will be accepted. Please do not attach individual files. Your submission must be a single ZIP archive.
Evaluation
Visualize Data: 20 points
Analysis and Select Appropriate Modeling Distribution: 20 points
Derive MLE estimator(s) for Distribution: 20 points
MATLAB code for estimators: 20 points
Markov Chain for weather: 20 points
Use Estimators to Simulate and Model: 20 points
Answers to Questions: 40 points
Total: 160 points
Note
Make sure you understand and are able to represent all of the mathematical steps involved in computing MLE estimators. Full credit for the written work is given when you represent all mathematical steps. Make sure you include a single MS-Word or PDF document. Please do not have separate JPEG files if you include images of written work. Make sure to include the JPEG in the same single document containing your written work.
2021-12-14