MATH6182 Coursework (2021-22)
Hello, dear friend, you can consult us at any time if you have any questions, add WeChat: daixieit
MATH6182 Coursework (2021-22)
1 Restaurant Performance Analysis
1.1 Purpose
• To develop your core Python skills to pull out useful information from a large dataset con- sisting of millions of entries.
• To train your Python programming ability to compute some key quantities and their visual- ization.
• To formulate a revenue problem as linear programming and solve it in pulp.
• To use Jupyter Notebook to conduct analysis and to present results.
1.2 Dataset
• The dataset constains simple record of orders in a restaurant, which has a few branches. Its manager would like to conduct a performance analysis of each branch as well as overall analysis as a brand. The restaurant has pulled out a data sheet. Your job is to help the manager extract useful information by compliling an analysis report that may be used to develop key performance indicators.
• The dataset can be found in the Blackboard coursework site (Restaurants_orders.zip). Let us have a look at some part of the data in order to explain the jobs you need to accomplish.
[1]: import pandas as pd
[2]: orders = pd .read_csv( 'Restaurants_orders.zip ')
orders .shape
[2]: (2387224, 10)
1.2.1 The dataset has more than two million rows and 10 columns. There is no way that this dataset can be explored manually.
[3]: orders .head(10)
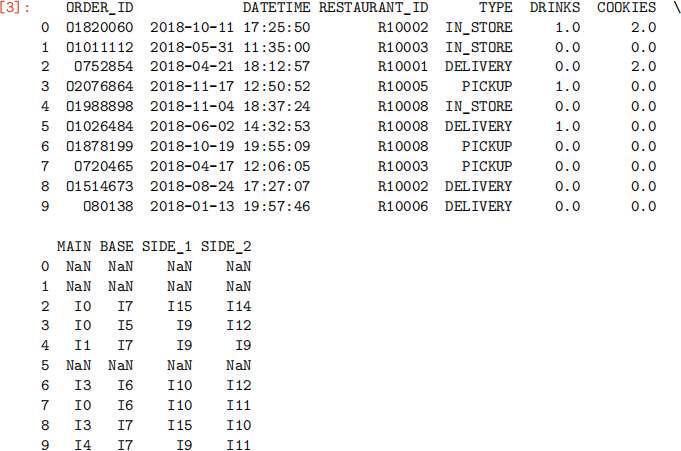
We first see how many branches there are in the dataset using .unique() method
[4]: Restaurant_id = orders .RESTAURANT_ID .unique() .tolist()
print(f 'Number of restaurants = {len(Restaurant_id)}')
print(sorted(Restaurant_id))
Number of restaurants = 8
['R10001', 'R10002', 'R10003', 'R10004', 'R10005', 'R10006', 'R10007', 'R10008']
1.2.2 Data information
• Each row represent one order, which may include drinks, cookies, main, base, side_1 and side_2.
• DATETIME column contains the date and time when an order has been placed.
• RESTAURANT_ID indicates the restaurant that an order has been placed. There are 8 different restaurants (or restaurant branches).
• TYPE: It has three values: IN-STORE, DELIVERY, PICK-UP. It indicates how an order is served.
• DRINKS column includes the number of drinks in each order. For example, 0 means no drinks ordered, 1 means 1 drink is ordered.
• COOKIES column includes the number of cookies in each order. For example, 0 means no cookies ordered, 1 means 1 cookie is ordered.
• MAIN, BASE, SIDE_1, SIDE_2 columns include either NaN (not a number, which means no order is place on the item) or a code sun as I10, which means a type of the item is ordered. We treat as one order.
2 Tasks
There are 4 tasks, each counts 25% for this piece of coursework
2.1 Task 1: Create your own dataset
• You should randomly remove some rows in the Restaurants_orders dataset to get your own dataset. This is to ensure that everyone will use a different dataset for the coursework. Please follow the following rule to remove your rows.
• The number of rows removed is the number of the last three digits of your student number.
– For example, if your student numer is 28935807, then the number of rows removed is
807. If your student number is 28935007, the last three digits is 007. Hence, the number of rows removed is 7. If your last three digits is 000, then use the first three digits in your student number.
• The rows to be removed must be random. You may set up your random seed in Python by your student number:
– Python code: import random, random.seed(your student number)
– Since you used the same seed, everytime you run your code, it will remove the same sequence of rows. Therefore you would get the same dataset for your own use.
• You may name and save your dataset as Mydataset or by a name you choose.
• You are expected to define a function that outputs your dataset. Your function should have two arguments: One is a dataset in Pandas’ DataFrame, and the second is your student number. Its structure is given below for your use.
This is an exmaple how you define your function to generate your own data
import random
def new_dataset(df, student_number):
# Two arguments of the function my_dataset:
# df is a dataframe such as orders defined above.
# student_number is your student number
random.seed(student_number)
# Insert here your code to randomly remove rows from df to meet the requirements above
# The resulting dataset is named as my_dataset
.
.
.
return my_dataset # output the new dataset.
”’
Having defined your function to generate your dataset, you can call it to generate your
own dataset
• my_dataset = new_dataset(orders, your student number)
• Everyone should have got their own dataset and they are all different. This is because that your student number is different and the number of row removed randomly is also different. You should work on your own dataset from now on.
”’
• Before you create your own set of data, you may want to make the DATETIME column in the DataFrame orders python readable
• Of course, you can do it with your own data set.
[5]: orders .DATETIME = (pd .to_datetime(orders .DATETIME))
print(min(orders[ 'DATETIME']))
print(max (orders[ 'DATETIME']))
2018-01-01 10:03:29
2018-12-31 22:57:15
• You can see that the data was collected over the whole year 2018.
2.2 Task 2: Performance analysis on individual branches
• Recall that each row of the dataset is an order on a certain day in a restaurant branch.
• The manager would like to know how many orders have been placed for each branch and whether there exists some trend.
– Pick one restaurant branch, say R10001, compute the number of orders in each week of the year.
– Plot the line graph of the number of orders against its corresponding week of the year.
– Repeat the above for all other branches so that you would have plotted eight graphs in total. Please comment on the trend of the number of orders (e.g., peak period, whether it happened in summer or in winter).
– You are suggested to create a loop over the restaurant ids so that it would generate all graphs in one go.
2.3 Task 3: Computing key quantities
2.3.1 Task 3.1: It is noted that there are three types of services (TYPE column): IN-STORE, DELIVERY and PICKUP. It is important to know the percentage of each service so as to understand their contributions.
(a) Pick one restaurant branch, say R10001, compute the following six quantities:
• For each type of DELIVERY, IN_STORE and PICKUP, compute
– Number_of_Orders: the total number of orders made in each type (e.g., by DE- LIVERY)
– Percent_of_Orders: the percentage of the orders above out of the toatl orders
• Hence, you would have calculated six quantities.
(b) Repeat the task in (a) for all other restaurants and put your outputs in a dataframe.
• Let us call your dataframe by type_summary.
• The index of type_summary should be of restaurant ids
• type_summary should have three columns: TYPE, NUMBER_OF_ORDERS, and PERCENT_OF_ORDERS.
• Print out your dataframe.
2.3.2 Task 3.2: Each restaurant branch also sells DRINKS and COOKIES. Suppose each drink costs £3.80 and each cookie sells for £1.20.
(c) Pick one restaurant branch, say R10001, compute the total revenue for DRINKS and COOK- IES combined.
• You are suggested to define a function, which takes two inputs.
• One input is your dataset.
• The other is a restaurant id of your chosen (e.g., R10001)
• The output of your function is the total revenue of that restaurant made from Drinks and Cookies.
• Print out your result.
2.4 Task 4: Pricing
Suppose the restaurant would like to creat a standard menu, which consists of the following items
• Drinks
• Cookies
• Main
• Base
• Side 1
• Side 2
The items can be ordered separately. For example, one order may contain 1 Drink, 1 Cookie, 1 Main and 1 Side 1 without ordering Base or Side 2. The restaurant wants to price those items so that they can achieve the highest revenue. They have the following conditions on the menu:
• A full order, which consists of one unit of every item available, should not cost more than £30.
• The cost of one drink, denoted as p_drink, should be between £2 and £4.
• The cost of one cookie, denoted as p_cookie, should be between £0.5 and £1.5.
• The cost of one unit of Main, denoted as p_main, should be between £8 and £25.
• The cost of one unit of Base, denoted as p_base, should be between £1 and £3.
• The cost of one serve of Side 1, denoted as p_side1, should be between £1 and £2.5.
• The cost of one serve of Side 2, denoted as p_side2, should be between £1.5 and £3. Now pick one restaurant branch by the following rule:
• If the last digit of your student number is one of the following digits {1, 2, 3, 4, 5, 6, 7, 8}, use your last digit to select your branch. For example, if your last digit is 4, pick the restaurant branch R10004.
• If the last digit of your student number is 0, pick the restaurant branch R10001.
• If the last digit of your student number is 9, pick the restaurant branch R10008.
Compute the following quantities for your selected restaurant branch:
• The total number of orders for Drinks. We denote it as n_drinks.
• The total number of orders for Cookies. We denote it as n_cookies.
• The total number of orders for Main. We denote it as n_main.
– Note that the value in each cell under the Main column is either NaN (not a number) or a string value (representing a type of main food). Each cell should count as 0 order if its value is NaN or as 1 one if its value is not NaN.
• The total number of orders for Base.
– We denote it as n_base. Each cell should count as 0 order if its value is NaN or as 1 order if its value is not NaN.
• The total number of orders for Side 1. We denote it as n_side1.
– We denote it as n_base. Each cell should count as 0 order if its value is NaN or as 1 order if its value is not NaN.
• The total number of orders for Side 2. We denote it as n_side2.
– We denote it as n_base. Each cell should count as 0 order if its value is NaN or as 1 order if its value is not NaN.
Use linear programming to formulate the problem of deciding the best prices for those items so that your chosen restaurant would generate the maximum revenue.
• Describe your linear programming formulation
• Solve your linear programming problem in PuLP.
• Print out your solution and the optimal objective value.
2021-12-14