DS5010 Introduction to Programming for Data Science
Hello, dear friend, you can consult us at any time if you have any questions, add WeChat: daixieit
DS5010 Introduction to Programming for Data Science
Homework #6
Assignment:
You are given a set of 10 csv files in Files directory on Canvas (HW6_EventData.zip). Each of these csv files shows a daily 250-minute observation of seismic events of an active volcano. In each of these csv files there are two columns, namely Time and Event, which takes values of either 1 or 0, where 1 means seismic event and 0 means no seismic event. Note that the Time data is given in seconds. As a data scientist, you are asked to find out if these events come in clusters. This homework is a preliminary work for your entire task.
Part-1 (30 points):
1) Read the csv files you are provided.
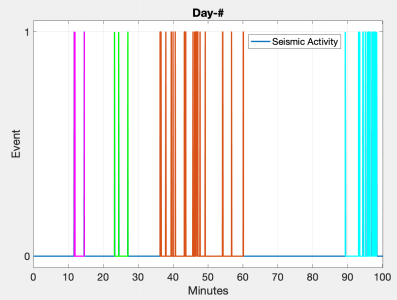
2) Plot 10 figures for each csv file.
3) Label x and y axis as Minutes and Event, respectively. Give a title for each plot, Day-#. Make the title bold. Include a legend.
4) Make sure that y-axis only shows 0 and 1.
5) Crate a 3x4 subplot figure using the 10 figures you created above (last two subplots will be empty, because you have 10 files to plot).
6) Add a global title in your figure, t-Minute Clustering. Delete individual legends in each subplot and make one legend for all subplots.
Part-2 (45 points):
1) Create clusters by coding: If the end of an event is within t minutes of the beginning of the next event, then assign these two events into the same cluster. Keep in mind that there could be more than one consecutive 1s in your data set.
2) Plot t = 10-minute clusters for each csv file in separate figures. Make sure that you color each cluster differently. For non-events use the standard blue color. You might want to change the line widths for a better visualization. Hint: You can predetermine 7 colors to use that are easy to distinguish to human eye. If there are more than 7 clusters in your plot, then you can start repeating colors at every 8th cluster. (This is for your debugging and testing purposes. You do not need to submit this). A visual example for 5-minute clustering is shown below:
3) Repeat 2) for t = 3 and 5 minutes.
4) Create 3 figures for t = 3, 5, 10-minute clusters. Each figure consists of 10 subplots. Follow the same coloring and labeling you did before.
Part-3 (20 Points):
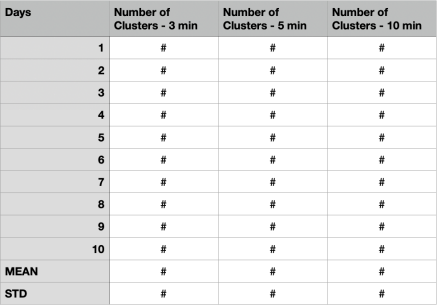
Write the number of clusters you obtained for t = 3, 5, 10 minutes for each file into a csv file (Naming format: firstName_lastName_HW06_part3.csv). The csv file should be in the following format, where # shows your results:
* You only need to submit your .py file. Make sure that when you run your code it is able to:
i) Do everything asked in Part-1.
ii) Display 3 figures that has 10 subplots in them (Part-2 figures).
iii) Create csv file like the example in Part-3.
2021-12-10