MATH253 Week 7 Tutorial
Hello, dear friend, you can consult us at any time if you have any questions, add WeChat: daixieit
MATH253 Week 7 Tutorial
This tutorial sheet is related to material covered in chapters 10 and 11. Some of the questions will be discussed in On Campus Workshop in Week 7. Please study the chapters 10 and 11 before attending the On Campus Workshop in Week 7.
Solutions will be available on Canvas on Friday at 5pm.
1. The following are the weight losses, in milligrams, of certain machine parts due to friction, when they were used with different lubricants.
Lubricant X: 12, 11, 7, 13, 9, 11, 12, 9
LubricantY: 8, 10, 7, 5, 6, 10, 7, 8, 11, 7, 8
LubricantZ: 9, 3, 7, 8, 4, 6, 6, 5
We want to test whether there are any differences between the three lubricants in terms of the mean weight loss due to friction.
(a) Write down the null and alternative hypotheses to be tested.
(b) Showing the details of your calculations, write down the ANOVA table and carry out the appro- priate hypothesis test.
(c) What are the underlying assumptions for the validity of this test?
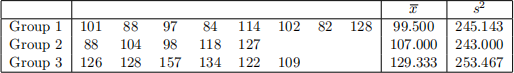
2. A total of 30 mothers, each of whom had an 18-month-old baby, agreed to take part in a study of children’s development. The mothers were randomly divided into three groups of 10, that did not meet each other.
Group 1 was given a simple instruction session on how best to provide a healthy diet for their children. Group 2 was given a session of the same length explaining how small children could be taught to read. Group 3 was given several sessions on how small children could be taught to read and was also given suitable teaching materials.
About one-third of the families moved out of the area and could not be followed up; however, at the age of 8, the remainder of the children were tested for reading ability and comprehension. The test scores and associated summary statistics were as follows:
R output from the Analysis of Variance included the following.
Df Sum Sq Mean Sq F value Pr(>F)
ind 2 3154 1577.2 6.38 0.00918
Residuals 16 3955 247.2
Anderson-Darling normality test
data: residuals
A = 0.34627, p-value = 0.4437
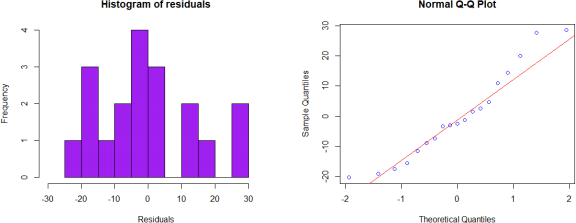
(a) Does the assumption of equal variances seem justified for these data?
(b) Does the assumption of normally distributed errors seem justified for these data?
(c) What conclusion can be drawn from the ANOVA analysis?
3. A farmer has three similar tomato patches. For the last 10 years, he has treated each patch with a different type of fertiliser (Type 1, Type 2, Type 3) to determine whether the type of fertiliser may influence tomato yield (occasionally a crop is lost due to external factors, and such observations are not considered). Each field starts with the same number of tomato seeds which are otherwise planted in the same way. Assume that tomato yield is normally distributed for each type of fertiliser. The data are summarised below in kilograms.
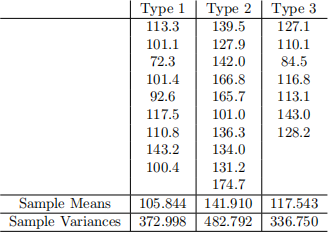
(a) Perform Analysis of Variance to test an appropriate hypothesis for these data. Report your con- clusions.
(b) Perform post-hoc tests for these data. Report your conclusions.
2021-12-09