MAT 4378-5317 Midterm
Hello, dear friend, you can consult us at any time if you have any questions, add WeChat: daixieit
MAT 4378-5317 Midterm (Fall 2021)
Gilles Lamothe
Instructions
1) Please submit your solutions to this assignment in one PDF file in brightspace. Only one file will be accepted.
2) Please provide your name and student number in the PDF that you will be submitting.
3) Only hand written (with a pen or pencil) solutions on paper are going to be accepted. For example, do not write your solutions on an ipad.
4) You can submit a PDF file more than once. However, only the last submission will be saved. If you want to modify your submission, that is fine as long as it is before the deadline.
5) It is not necessary to submit the statement of the questions. Please only provide your answers to the questions.
6) Late submissions of the assignment are not going to be marked.
7) For the short answer questions, you can only use R to compute few quantiles and probabilities from probability distributions such that the binomial, Poisson, normal, chi-square, and beta distributions.
8) Please combine images of your hand-written solutions as one PDF. (See https://imagetopdf.com/ as a possible solution to combine images as one PDF). Alternative, see https://www.camscanner.com/
9) Please submit your solutions before 4 pm.
![]() Short Answer Questions:
Short Answer Questions:
1. Consider two independent binomial experiments. Here is a representation of the data.
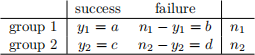
a) The (sample) odds ratio for this table is

Show that the  is equal to

The latter is the ratio of the odds of success versus failure for group 1 relative to group 2.
(b) Use the delta method to show that
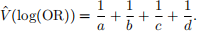
Hint: Find a function g such that log(OR) = g(πl , π2 ), and use the following linear approximation

2. Answer the following questions.
(a) Consider a binomial experiment with n trials and π is the probability of success. Let ![]() be the mle for π. Suppose that we observed y = 21 successes in n = 25 trials. Give a 95% logit confidence interval for π .
be the mle for π. Suppose that we observed y = 21 successes in n = 25 trials. Give a 95% logit confidence interval for π .
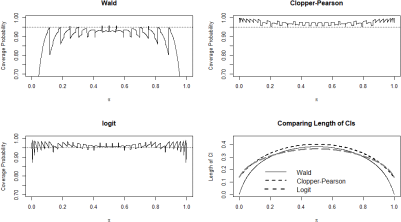
(b) We will compare the logit interval to the Wald interval and the Clopper-Pearson interval. We computed the coverage probability for π ranging from π = 0.001 to 0.999 in increments of 0.0005. We assumed that n = 25. We plotted the coverage probabilities, see the first three panels below. The last panel is a plot of the expected length of the interval. Write a short paragraph comparing the three methods. (Do not just indicate which is best and and which is worst. Describe in which way the method is the best or the worst.)
2021-12-04