STAT 478 Homework #13
Hello, dear friend, you can consult us at any time if you have any questions, add WeChat: daixieit
STAT 478
HW #13- 1
Homework #13
1. A researcher studied the phosphorus content of leaves in three different plants. The data are in the table at right. Note that this is a balanced design with 5 observations of each plant type.
a) (2) Define DA as the (0, 1) indicator variable for type A and DB as the (0, 1) indicator variable for type B. The resulting least squares regression equation is ![]() = 0.71 –
= 0.71 –
|
Type |
Phosphorus Content |
Mean |
|
A |
.35 .40 .58 .50 .47 |
0.46 |
|
B |
.65 .70 .90 .84 .79 |
0.78 |
|
C |
.60 .80 .75 .73 .66 |
0.71 |
0.25DA + 0.07DB . What does the value of 0.71 represent in the context of phosphorus content for type A, B, or C? What does the value –0.25 represent?
b) (2) Define D’A as the coded value that equals 1 for type A, –1 for type C, and 0 else. Define D’B as the coded value that equals 1 for type B, –1 for type C, and 0 else. The resulting least squares regression equation is ![]() = 0.65 – 0.19D’A + 0.13D’B. What does the value of 0.65 represent in the context of phosphorus content for type A, B, or C? What does the value of–0.19 represent?
= 0.65 – 0.19D’A + 0.13D’B. What does the value of 0.65 represent in the context of phosphorus content for type A, B, or C? What does the value of–0.19 represent?
2. An experiment was conducted to see if flies are more attracted to honey than vinegar or water. At right are the observed number of flies for dishes of honey, vinegar, and water in a total of 12 different locations (5 for honey, 4 for vinegar, and 3 for water).
a) (2) Calculate the group means ![]() i ⋅ for each of honey, vinegar and water. Calculate the (weighted) grand mean,
i ⋅ for each of honey, vinegar and water. Calculate the (weighted) grand mean,
|
Color |
Fly Counts |
|
Honey |
10 12 9 8 12 |
|
Vinegar |
2 1 4 2 |
|
Water |
2 3 4 |
![]() ⋅ ⋅
⋅ ⋅
b) (6) By hand, calculate the SSTr = ∑i(k)= 1 ni(![]() i ⋅−
i ⋅−![]() ⋅⋅)2 and SSE = ∑i(k)= 1 (yi j −
⋅⋅)2 and SSE = ∑i(k)= 1 (yi j −![]() i ⋅)2 .
i ⋅)2 .
c) (4) Record the complete ANOVA table (you may either complete the calculations by hand or use the computer).
d) (2) From the ANOVA table, test whether liquid type (honey, vinegar, or water) affects the number of flies attracted. Record either the p-value or the critical value and your conclusion.
3. Table B.13 gives data on possible predictors for the thrust of a jet engine. The output from the best subsets is presented below (just the best model for each number of variables is shown). Note “X” indicates that a given variable is in the model. I have also included information on AIC and BIC for most of the models. Note: for convenience I have labeled the models by A, B, ….
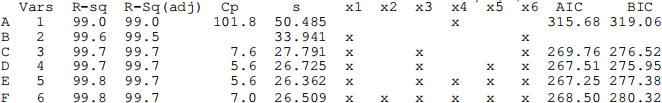
a) (1) Note that there are 6 potential explanatory variables. How many total models are possible (excluding the intercept-only model)?
b) (1) Which variables are included in model C?
c) (1) Using the smallest MSE criterion, which model is preferred? Hint: remember that MSE = s2 .
d) (4) Refer to model B. Calculate Mallow’s Cp for this model. Note that there are n=40 observations.
e) (3) Using the Mallow’s Cp criterion, which models are considered acceptable?
f) (6) Refer to model B. Calculate AIC and BIC for this model.
g) (2) According to the AIC, which model is preferred? According to BIC, which model is preferred?
4. Refer again to the data in Table B.13. The data are available on Blackboard. Starting with all 6 possible explanatory variables, use the computer to perform backwards elimination and stepwise.
a) (2) Using backwards elimination, which variables are in the final model?
b) (2) Using stepwise, which variables are in the final model?
2021-12-01