CS544 Module 2 Assignment
Hello, dear friend, you can consult us at any time if you have any questions, add WeChat: daixieit
CS544 Module 2 Assignment
Part1) Probability - 25 points
Use the Bayes theorem to calculate the following probabilities. Show the individual steps of the Bayes theorem. You can use R for the calculations. Use the Word document for this part.
Suppose that in a particular state, among 10000 people surveyed, 4250 people are in the age group 18-34 years, 2850 people are in the age group 35-49 years, 1640 people are in the age group 50-64 years, and the remaining are 65 years & over.
Out of those in the age group 18-34 years, 1062 people had a BMI of above 30. Of those in the age group 35-49 years, 1710 people had a BMI of above 30. Among those in the 50-64 years range, 656 people had a BMI of above 30. In the last age group, 189 people had a BMI of above 30.
a) What is the probability that a randomly selected person in this survey will have a BMI of above 30?
b) If a randomly selected person had a BMI of above 30, what is the probability of that person being in the age group 18-34 years?
c) If a randomly selected person had a BMI of above 30, what is the probability of that person being in the age group 35-49 years?
d) If a randomly selected person had a BMI of above 30, what is the probability of that person being in the age group 50-64 years?
e) If a randomly selected person had a BMI of above 30, what is the probability of that person being in the 65 years & over?
Part2) Random Variables - 25 points
Consider a game which involves rolling three dice. Write the R code for the following.
Using the rollDie function from the prob library, setup the sample space for this experiment with the probability space.
For each of the following scenarios from a) through e), show the corresponding outcomes and the probability of that event. The sample outputs for b) are shown as example.
a) The sum of the rolls is greater than 6 but less than 10.
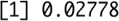
b) All the three rolls are identical.
Sample Output for outcomes:
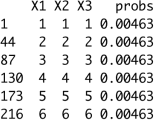
|
|
Sample Output for probability:
c) Only two of the three rolls are identical.
d) None of the three rolls are identical.
e) Only two of the three rolls are identical given that the sum of the rolls is greater than 9.
Part3) Functions - 20 points
Using a for loop or a while loop, write your own R function, sum_of_first_N_odd_squares (n),
that returns the sum of the squares of the first n odd numbers.
For example, if n = 5, the first five odd numbers are 1, 3, 5, 7, 9 and the required result is 12 + 32 + 52 + 72 + 92 = 165.
Test your function as follows:
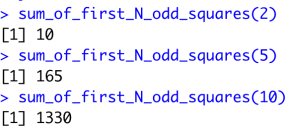 |
Now, without using any loop, write your own R function, sum_of_first_N_odd_squares_V2 (n),
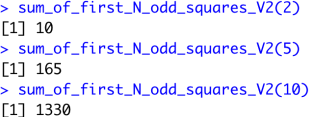 |
that returns the sum of the squares of the first n odd numbers. Test your function as follows:
Part4) R - 30 points
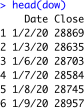
Initialize the Dow Jones Industrials daily closing data, dow, using the read.csv function with the link: http://people.bu.edu/kalathur/datasets/DJI_2020.csv
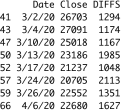
The first 6 rows of the dataset are as shown below:
Provide the simplest R code and output for all of the following. The code should work for any given data.
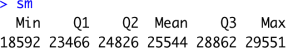
a) Store the result of the summary function for the Close attribute as the variable sm. Change the names of this variable so that the output appears as shown below.
 |
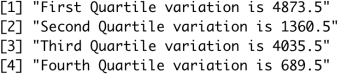
Using the above data, show the quartile variations for the 4 quartiles as shown below. You can use paste or sprintf.
 |
b) Produce the output for the minimum of the Dow closing value in the dataset as shown below:
|
|

c) Suppose you have an index fund tied to the Dow closing value. If you have invested on the minimum date, what date from the dataset you would have sold to gain the maximum percentage gain. The output is as shown below. Note that the code should be generic so that it works on any such dataset.
|
|

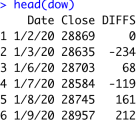
d) Use the diff function to calculate the differences between consecutive closing values in the dataset. Insert the value 0 at the beginning of these differences. Add this result as the DIFFS column of the data frame. The result is as shown below.
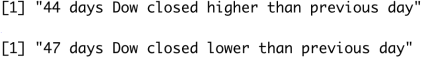
e) How many days did the Dow close higher than its previous day value? How many days did the Dow close lower than its previous day value?
 |
f) Show the subset of the data where there was a gain of at least 1000 points from its previous day value.
 |
Submission:
When the term lastName is referenced, please replace it with your last name.
Create a folder, CS544_HW2_LastName_Last4DigitsBUID and place the following files in this folder.
Provide all R code in a single file, CS544_HW2_LastName_Last4DigitsBUID.R. Clearly mark each subpart of each question.
Provide the corresponding outputs from the R console in a single Word document,
CS544_HW2_LastName_Last4DigitsBUID.doc.
Archive the folder (CS544_HW2_LastName_Last4DigitsBUID.zip). Upload the zip file to the Assignments section of Blackboard.
2021-11-29