Stat 133 Project 3: Text Analysis of U2’s Song Lyrics
Hello, dear friend, you can consult us at any time if you have any questions, add WeChat: daixieit
Project 3: Text Analysis of U2’s Song Lyrics
Stat 133, Fall 2021
Introduction
In this project, you will build a shiny app to visualize the results from a text analysis performed on the song lyrics of Irish rock band U2.
● Part I on Data
● Part II on Text Analysis
● Part III on Shiny App

We are assuming that you have reviewed the learning materials of weeks 11, 12, and 13 (see bCourses).
Part I: Data

U2 Song Lyrics Dataset
The data for this project involves the song lyrics of Irish rock band U2. We don’t expect that you know the discography of this band but just in case, here’s their wikipedia entry if you want to read a little bit about them:
https://en.wikipedia.org/wiki/U2_discography
The data was webscraped by Prof. Sanchez from the website AZLyrics:
https://www.azlyrics.com/u/u2band.html
BWT: Prof. Sanchez is not a U2 fan; he is interested in their lyrics purely from a text data analysis standpoint.
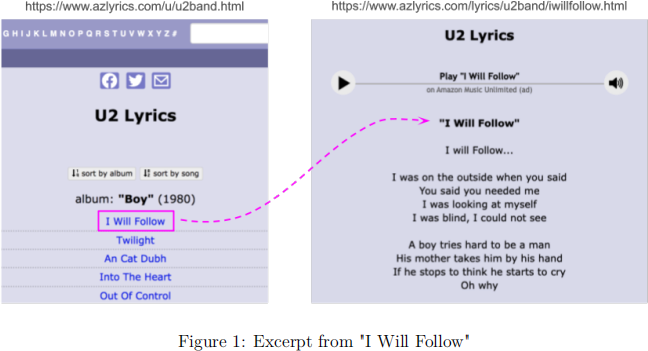
1.1) Data file u2-lyrics.csv
We are providing a CSV file u2-lyrics.csv located in the folder containing this pdf of instructions (see bCourses folder Files/hws/project3)
This data set is fairly simple—in terms of its structure—although the text content is far from being tidy. The dataset has 211 rows and four columns:
1) album: name of the album
2) year: year of released album
3) song: name of song
4) lyrics: text with song lyrics
Part II: Text Analysis

Listed below are four major text analysis ideas for you to get inspiration from. We are also including recommended readings (some available in bCourses, some available in the book “Text Mining with R”, by Silge & Robinson).
Out of the four listed types of text analysis (2A-2D) you will have to choose two of them in order to create the shiny app.
2.A) Word Frequency Analysis
Taking into account all the “words” (i.e. tokens)
● what are the top-5, or top-10, or top-20 (or any other number of) most frequent words used in U2 lyrics (among all albums)?
● what are the top-5, or top-10, or top-20 (or any other number of) most frequent words for a given album?
● what are the top-5, or top-10, or top-20 (or any other number of) most frequent words per album (hint: facet by album)?
After removing stopwords:
● what are the top-5, or top-10, or top-20 (or any other number of) most frequent words used in U2 lyrics (among all albums)?
● what are the top-5, or top-10, or top-20 (or any other number of) most frequent words for a given album?
● what are the top-5, or top-10, or top-20 (or any other number of) most frequent words per album (hint: facet by album)?
Suggested reading
● text-mining-1-pride-and-prejudice.html (see Files/readings in bCourses)
2.B) Sentiment Analysis
You can also perform a sentiment analysis. For example:
● Compute a sentiment score for each song, or for each album. And then rank them from more positive to more negative.
● Which songs have “relatively large” positive scores? And/or what words contribute the most for the score?
● Which songs have “relatively large” negative scores? And/or what words contribute the most for the score?
Suggested reading
● text-mining-3-sentiment-analysis.html (see Files/readings in bCourses)
● See also section 2.4 “Most common positive and negative words” (in “Text Mining with R”; link below)
https://www.tidytextmining.com/sentiment.html#most-positive-negative
2.C) Bigram Analysis
Another type of analysis involves studying so-called bigrams for answering questions like:
● what kind of words tend to be associated with other words?
Suggested reading
● text-mining-2-pride-and-prejudice.html (see Files/readings in bCourses)
● See chapter 4 “Relationships between words: n-grams and correlations” (in “Text Mining with R”; link below)
https://www.tidytextmining.com/ngrams.html
2.D) Word Trend Analysis
Lastly, you can also explore with word trend analysis. For example, how do the following words (or other words) have been used in U2 lyrics over the years?
● “love”
● “feel”
● “heart”
● “day”
● “night”
● “soul”
Suggested reading
● See figure 5.4 in “Text Mining with R” (link below) to get a rough idea about this type of trends over time.
https://www.tidytextmining.com/dtm.html#tidying-dfm-objects
Part III: Shiny App

3) Shiny App
The main data product to be delivered for this assignment is a shiny app that allows the user to explore the results of two types of text analysis.
For example, you can choose 1) a word frequency analysis, and a 2) sentiment analysis. Keep in mind that even if two (or more) students choose to work on the same type of analyses, there is still enough room to approach them in slightly different ways, therefore producing different shiny apps, with different scopes, and of course different data visualizations and outputs.
3.1) Layout
You can find a template R script file app-template.R in the folder containing this pdf of instructions (see bCourses folder Files/hws/project3).
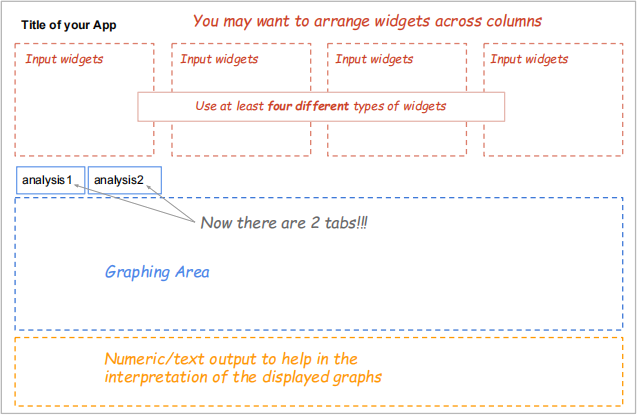
As you can tell from the above diagram, the layout of the app is very similar to the shiny app of project 2. The main difference in the app for this third project is in the fact that it uses two tabs:
1) Analysis1: this tab is for displaying the results for one type of text analysis (for example: word frequency analysis)
2) Analysis2: this tab is for displaying the results for another type of text analysis (for example: sentiment analysis)
From the diagram above, note that there are four distinctive sections in the layout—see template file app-template.R:
● title: main title for your app (give it a meaningful name).
● input widgets: the template already contains five input widgets arranged in four columns; but you can change this configuration, as well as the types and number of widgets.
● plot: an output area to display graph(s).
● stats: an output area (e.g. for a table, text, etc) to display numeric/text output.
4) Submission
1) R file: You will have to submit the source app.R file (do NOT confuse with an Rmd file) containing the code of your app.
2) Link of published app: You will also have to submit the link of your published app in shinyapps.io (the free version). Share the link with us in the comments section of the submission in bCourses.
3) Video: In addition to the app.R file and the link of your published app, you will also have to record a video—maximum length of 4 mins—in which you show us your published shiny app, how to use it, and a description of its outputs.
4) Important: You do NOT have to submit any Rmd or html files this time. Also, we will not accept any content sent by email. We will only grade the app.R file submitted to bCourses, the public link of the video, and the link of your app in shinyapps.io.
5) Some of the things we will pay attention to
We will pay attention to the visual appearance of the graphics (e.g. type of graph, use of colors, supporting elements such as grid lines, text, labels, legends, annotations, etc.). This does not mean that your graphic must have all possible visual elements. Instead, this means that we will assess the effectiveness of your graph in terms of the displayed information, taking into account good practices of data visualization.
We will also evaluate the effectiveness of the numeric and/or text output displayed in your shiny app, in terms of providing understanding and insight for each of the analysis.
Likewise, we will also assess your video. Make sure that the image and sound quality of your video are acceptable (avoid background noise, inaudible voice, highly pixelated images, trembling camera movements, and things like that). You may need to rehearse what you will say in your video a couple of times before its definitive recording.
Above all, put yourself in the place of a generic user who will use your app without you being there to explain them how to use it, or to tell them how to make sense of the displayed information. We will examine your published app without necessarily watching your video at the same time. If something needs an explanation, make sure to include it in your app (not just in your video).
Resources
You may want to take a look at the Shiny gallery:
https://shiny.rstudio.com/gallery/
Shiny widgets gallery:
https://shiny.rstudio.com/gallery/widget-gallery.html
Share you app with shinyapps.io:
https://vimeo.com/rstudioinc/review/131218530/212d8a5a7a/#t=30m35s
Of course, you can take a look at other apps displayed in the Shiny gallery to get some inspiration.
2021-11-26