FINC7024 Investments and Portfolio Management, AY21/22
Hello, dear friend, you can consult us at any time if you have any questions, add WeChat: daixieit
FINC7024 Investments and Portfolio Management, AY21/22
Project 2
Instructions
This is a group project, and only one of your group members should email me the answers using Excel, Word, or PDF files before the deadline.
Answers will be graded for content and appropriate presentation. Partial marks are available. Please show your work when appropriate.
Data analysis software such as Stata, SAS, EViews, R are recommended to solve this assignment, but Excel can also do the job which should be much harder in my opinion. Treat this project as a simplified task you may encounter in industry and figure out how to solve them.
Late submission is NOT accepted unless there are valid reasons.
Questions
In this project, you will work with Fama-French three-factor model and replicate part of the findings in their seminal paper which was discussed in class by assuming the market only has 30 stocks.
In the file “Data for Project 2.xlsx”, sheet “Monthly Returns” contains the same data as in Project 1. Sheet “Market Values ($bil)” contains the market capitalization for each of the 30 companies from January 2010 to December 2019.
Please perform the following tasks:
1) Find and download the SMB and HML factor returns (monthly) from Prof. Kenneth French’s website. (Please do not send me the data, you can list the download link for checking if you want)
Hint: Look for the 3 factors data at monthly frequency.
2) Estimate alpha and beta for each of the three stocks you selected using Fama-French three-factor model, interpret the results, and compare the alpha with that from CAPM.
Hint: note that SMB and HML factor returns should be used directly in regressions because they are long-short portfolios (no risk-free rate involved). Also use the risk-free rate directly from the Kenneth’s data for calculation.
3) Replicate the findings that appeared in note 7 slide 27 with the 30 stocks in a simplified way. The purpose is to see whether firms with higher CAPM beta estimated using historical data earn higher one-year future return than firms with lower beta in this small sample. In particular, since we have a small number of stocks, let’s form 5 portfolios from CAPM beta. Comment on the results.
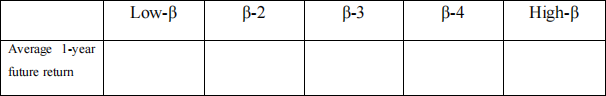
Outline of steps:
1. At the beginning of July 2015, estimate beta for each stock based on returns of past 60 months (July 2010 to June 2015) using market excess return from Prof. Kenneth (available together with SMB and HML):

2. Sort the 30 stocks according to estimated beta in step 1 and construct 5 portfolios based on estimated beta, with portfolio 1 (call it
) containing the 6 lowest-beta stocks, portfolio 2 (
) containing the 6 second lowest-beta stocks, …, and portfolio 5 (
) containing the 6 highest-beta stocks.
3. Compute the 1-year “future” buy-and-hold return (July 2015 to June 2016) for each of the 30 stocks. Then compute the returns of portfolios formed in step 2 (the returns of
4. Repeat step 1 to step 3 three more times for each of
July 2016 (compute the returns of
,…,
).
July 2017 (compute the returns of
,…,
)
July 2018 (compute the returns of
,…,
)
5. Calculate the average 1-year future returns for each of the 5 beta-sorted portfolios over the 4-year period from July 2015 to July 2018.
For example, the average 1-year future return for Low-β portfolios from 2015 to 2018 is computed as
, where
represents the 1-year future portfolio return of
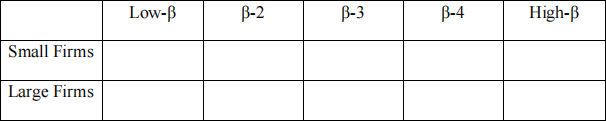
4) Extend the results in part 3) by considering the impact of firm size (measured by market capitalization). In particular, within each of the 5 portfolios, form two sub-portfolios according to firm size. For example, at the beginning of July 2015 (for the year July 2015 to June 2016), firms should be sorted by market capitalization using June 2015 value.
2021-11-24