Statistics for Finance
Hello, dear friend, you can consult us at any time if you have any questions, add WeChat: daixieit
Statistics for Finance
Final Project
Complete the tasks below:
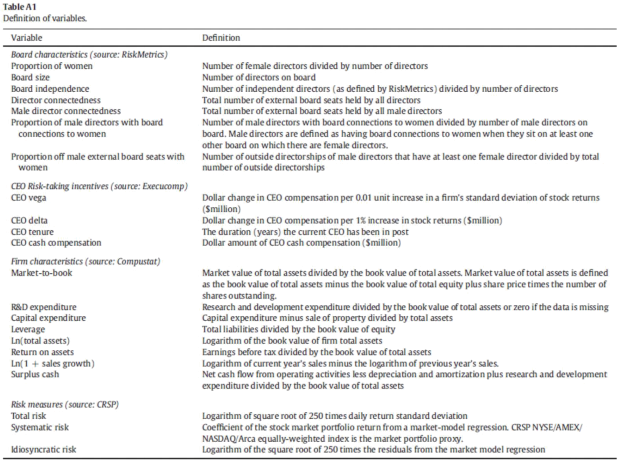
1. Using Capital IQ, download data for at least 50 US firms for the period 2013-2020. Make sure that your sample includes at least 2 firms in the manufacturing sector. Present a table of variable definitions. Label this table: Table1: Variable Definitions. Make sure to include all the variables used in the regressions. (450 words max)
[5 marks]
2. Present a table of summary statistics for all the variables used in the project (including the components of Tobin’s Q, although you don’t need to define each component in Table1). Make sure to include: mean, standard deviation, min, max, 25% percentile, 50% percentile, 75% percentile, number of firms, number of firm-year observations. Check that your sample is balanced (e.g. the 50 firms have data throughout the period of study). Label this table: Table2: Summary Statistics and include a legend at the end of the table that defines each variable; e.g. Price denotes Day Close Price; Equity denotes Total Common Equity, etc.
[5 marks]
3. Firm size is measured as log(Total Assets). Performance is measured with Tobin’s Q (total assets plus market value of equity less book value of equity divided by total assets; where market value of equity equals price per share times the total number of shares outstanding). Choose the largest firm of your sample. Using a difference in means test assess whether this firm performed better in the second term of Obama’s presidency (2013-2016) than in Trump’s presidency period (2017-2020). Show the results of your test (a direct output from STATA or SAS) and label this table: Table3: Differences in Means Test. Do you reject the null hypothesis? Say Yes or No and explain how did you get to this conclusion (50 words max).
[5 marks]
4. Write 2 limitations of the test above (50 words max)
[5 marks]
5. You will assess whether the average manufacturing firm had a better performance than the average non-manufacturing firm during the Donald Trump era (this was one of his target sectors in his “America First” narrative). To do this, you will need to run a cross-sectional regression controlling for firm size. First, compute a time average for every variable for each firm in this time-period. Then, run a regression that enables you to assess whether manufacturing firms are associated with better performance. Label this table: Table 4: Regression Results- Trump
[5 marks]
6. Based on your regression results in Table 4, discuss whether manufacturing firms perform better than non-manufacturing firms. Make sure to discuss statistical significance and interpret beta. (50 words max).
[5 marks]
7. Run a similar regression to that in (4) but for the Obama period and report your results in Table 5: Regression results- Obama. Based on the regression results you have so far, did Trump deliver on his promise to support manufacturing firms? Say Yes or No and explain your answer. (100 words max). Hint: Assume the OLS assumptions hold (although only for this answer).
[10 marks]
8. Now you will run a cross-sectional regression using all the time-periods (i.e. use averages based on 2013-2020), industry dummies and firm size. Make sure the manufacturing dummy is not the base category. Is the OLS beta estimator for manufacturing the minimum variance estimator? Say Yes or No and justify your answer (150 words max)
[10 marks]
9. Add the following variables to the regression:
a. a sensible explanatory variable of your choice (you may need to look at some academic papers to make a good choice).
[5 marks]
b. A sensible dummy variable of your choice (you may need to look at some academic papers to make a good choice)
[5 marks]
Include the table with results. Make sure a definition of the added variables and reference(s) to justify your choice are added at the end of the table. For example: Board Diversity: is gender diversity computed as the ratio of women directors divided by the number of directors (Adams and Ferreira, 2000). Label this table: Table 6: Multiple Regression Model
10. Discuss whether the variable chosen in 9a. above is statistically significant at the 5% level and interpret your result (50 words max).
[5 marks]
11. Discuss whether the variable chosen in 9 b. above is statistically significant at the 5% level and interpret your result. (50 words max).
[5 marks]
12. Assume your variable of interest is size. Give an example of an omitted variable that is not possible to include in the regression that could lead to a negative bias and include a brief explanation. (100 words max)
[10 marks]
13. Researchers typically use returns rather than prices when running regressions. Explain whether this could be related to fulfilling the OLS assumptions. Feel free to include graphs or figures if this adds value to your explanation. (100 words max)
[10 marks]
14. Using daily prices for 2020 for one of your manufacturing firms (you do not need to include this variable in the descriptive statistics or any of the questions above), what is the predicted price for January 1st 2021 based on the random walk model? Clearly show how you estimated this price and discuss whether this is a good prediction. (100 words max)
[10 marks]

2021-11-22