INFS5710 Information Technology Infrastructure for Business Analytics
Hello, dear friend, you can consult us at any time if you have any questions, add WeChat: daixieit
INFS5710 Information Technology Infrastructure for Business Analytics
Project Statement
● This project accounts for 30% of the total marks for this course.
● The deliverable is a PowerPoint file with video narration and speaker notes, and an appendix file.
Bike sharing has become increasingly popular across the globe. Today, such programs operate in roughly 1,000 cities, with more than half a million bicycles in use. The principle of bike sharing is simple: individuals use bicycles on an as-needed basis without the costs and responsibilities of bike ownership. It is short-term bicycle access, which provides its users with an environmentally friendly form of public transportation. This flexible scheme targets daily mobility and allows users to access public bicycles at unattended bike stations; bicycle reservations, pickup, and drop-off are all self-service. Commonly concentrated in urban settings, bike sharing programs also provide multiple bike station locations that enable users to pick up and return bicycles to different stations.
This project is about the bike-sharing scheme in the metropolitan area of Los Angeles (LA), a large city in the US with a population of several million. You are a business consultant working for the bike-sharing program.
Bike-sharing data
Your manager just referred you to download historical bike-sharing data from the following site: https://bikeshare.metro.net/about/data/, which contains data of more than 1.2 million bike trips from July 2016 Q3 – 2021 Q3. Since the data come from the US, please be aware of the difference in date formats between the US (mm/dd/yyyy) and Australia (dd/mm/yyyy).
You can also find in the data files the locations of bike stations in the GPS coordinate system. For example, the coordinate of a station is (x, y), where x is the longitude coordinate and y is the latitude coordinate. The following link helps you to understand more about the GPS coordinate system: https://www.ubergizmo.com/how-to/read-gps-coordinates/
Suppose a bike rental starts from (x1, y1) and ends at (x2, y2), how should you estimate the distance traveled? In this project, it is recommended that you estimate it using the so-called taxicab distance, which is |x1 − x2| + |y1 − y2|. See the following figure for interpretation. For more information, please see https://study.com/academy/lesson/taxicab-geometry-history-formula.html. Note that whether the distance is in degrees (without any conversion from longitude-latitude coordinates), miles, or kms, your findings, interpretations or insights should not change.

Weather data
Weather plays an important role when people decide whether or not to use bike-sharing. You are required to explore the relationship between weather (e.g., temperature, wind speed and humidity) and the bike-sharing rentals in this project. There are two known ways to download free historical weather data. The first way is to manually capture weather data month by month from Weather Underground (wunderground.com).
● First visit https://www.wunderground.com/ and try to search the weather condition in Los Angeles. (There are other locations that you may also try, e.g., Santa Monica and Valley Village, where there are many bike stations as well.)
● You will be led to the site of a weather station near Los Angeles, which may be different from time to time.
● Click the History tab on the page, and then choose to view Monthly weather data. Once you choose a month, click View. For example, the following link shows the weather data of June 2020 measured at the Burbank station (near Los Angeles): https://www.wunderground.com/history/monthly/us/ca/burbank/KBUR/date/2020-6
● Scroll down the page, and you will see the table of Daily Observations. Use your mouse to copy the table and paste it to an Excel spreadsheet.
● Copy only the data required, i.e., July 2016 Q3 – 2021 Q3, for this project.
Another way, as suggested by a former student, is to download weather data from NOAA. Try: https://www.ncdc.noaa.gov/cdo-web/search. Search for "Daily Summaries" at relevant weather stations for a time period then "Add to Cart" - NOTE that this is a free service, but you'll have to type in an email address so that you can get the data download link once it processes.
Holiday data
Another factor that influences the bike-sharing rentals is holidays. You can easily search the dates of the US federal holidays and/or California state holidays each year.
The Task
Your manager asked you to collect and analyze the data and “let the data speak.” You understand that the company wants to further grow the market and induce more users. Before they do it, they want to have some insights from the data.
In this project, you are expected to manage and clean the data collected; some of them may contain missing data, different formatting, and incomplete information. The goal is to overcome such obstacles commonly encountered in reality to derive business insights from the datasets that can be used to promote the bike-sharing program in LA.
You need to first identify no more than three research topics to study, by utilizing the bike-sharing, weather, and holiday data. For each research topic, you must conduct a chronological analysis. For example, how has the bike-sharing demand evolved over the past few years? Most notably, COVID arrived in the US in early 2020, and is more contained in 2021 due to increasing vaccinations. From your chronological analysis, you should be able to see how the pandemic impacted LA’s bike share program and people’s perception of biking. Also note the introduction of motor bikes in late 2018 (and COVID), which may have significantly changed customers’ demand for bike sharing. Basically, in a chronological analysis you study pattern changes over years or quarters rather than present an overall, averaged result, per se. It is more preferred that you study one topic in depth than multiple ones superficially.
You are required to use SAS Enterprise Guide (EG) for this project. To begin with the ETL (extract, transform and loading) process, you need to prepare your data in proper tables that will go into SAS. That is, you need to create tables in the SAS environment.
Whenever you want to conduct an analysis, you must write a query to select relevant attributes by properly joining multiple tables to obtain a resultant table for specific analysis. See Appendix for using some common data analysis and visualization functions of SAS EG. More features of SAS EG will be introduced in a tutorial session later. (Note: it is possible that you may not be able to plot your desired graphs using SAS EG. If necessary, you may use other software such as Excel for graphing.)
Finally, please note that the management (or the LIC) does not know anything beyond this project statement. Therefore, you need to use your own judgement and make necessary and reasonable assumptions when doing this project. Make sure to present all assumptions made in the project.
Project Deliverable
Your group will submit a PowerPoint file with your video, audio narration recorded, and speaker notes. You should write your speaker notes in the Notes Pane for each slide. When you are recording your presentation video, you will speak following your own speaker notes in each slide. This will enable the LIC to both listen to your narration AND read your speaker notes when marking your project. While it is preferred that you turn on camera to show your face when you are making the presentation, it is also known that Mac users may not be able to show their faces on the PPT.
In addition to your PPT submission, you also need to submit an appendix (in pdf format) that contains supporting materials and queries. You should provide a good referencing in your appendix such as “this query supports table x or figure y on slide z”.
DO NOT TURN IN A VIDEO FILE. PowerPoint includes a feature for recording slides. Here is a step-by-step reference: https://www.ou.edu/cas-online/website/documents/Narrated%20Powerpoint%20(Office%20365).pdf
Follow the steps for “Preparing to Record” and “Recording Narration.” You should ignore the last paragraph of this document on P. 4 and do not convert the PowerPoint file to a video file.
Your presentation should be limited to 10 minutes with no more than 10 static slides that contain no animations or 'movement' of any description. In each slide, please properly place your video box so that it does not cover any important content.
Slide structure
The following is a suggested structure of your presentation:
● 1st slide: Introducing group members (including their names and Class_IDs) and show your group name (column E on the group signup spreadsheet, e.g., H16A Group 2).
● 1 - 2 slides: Briefly describe how you prepare the data for analysis, including how you clean data, manage missing information, and how you organize tables that go into SAS.
● The rest slides: Research Topic I, Research Topic II, up to Research Topic III. For each topic, you should describe the research question, major findings (in terms of data visualization such as charts), business insights and recommendation.
● Please be aware that Moodle does not take a submission with file size larger than 200 MB. A 10-minute PPT with video will not automatically make your file large, but a fancy PPT theme, careless copying and pasting figures to your PPT containing data, and/or using some original, high-definition images could easily make the file size exceeding 200MB. Please pay attention to this implicit limit on file size as well.
Marking guideline
|
Item (%)
|
Description
|
|
Data preparation (25%)
|
Do you properly manage missing data?
Do you properly preprocess the tables used by SAS?
|
|
Quality of the data analysis (40%)
|
Are your research questions interesting and are not trivial?
Are your research questions or hypotheses meaningful to the business?
That is, can the data support your argument?
Have you properly analyzed the data with the right functions or steps?
Have you provided proper data visualization (for example, table or
graph) to present and support your analysis?
|
|
Quality of business insights obtained and
recommendation (25%)
|
Do you obtain business insights from the data?
Are your obtained insights helpful for business?
Do you provide proper recommendations to make use of the obtained
insights?
|
|
Presentation and recording quality (10%)
|
Is your presentation clear and effective to professional standards?
|
|
Total (100%)
|
|
Appendix: Using Enterprise Guide for Data Analysis and Visualisation
Given a data file opened in SAS Enterprise Guide, you can see some analysis and visualisation functions available (from the tool bar below).

Most functions are straightforward to use. Graphs can be found under Graph; some useful analysis tools can be found under Analyze in the tool bar. You are expected to try them by yourself.
Note that the data visualisation functions only apply to a SAS data file only. When you write a query, before you can graph the table of the query outcome, you need to save the result table as a SAS data file using “create” statement, which has been introduced previously.
Graphing:
Line Chart
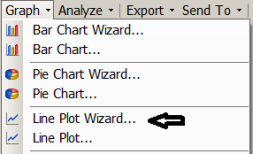
Bar Chart
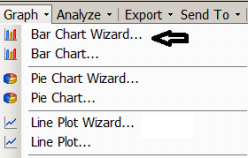
Histogram
If you are not familiar with the concept of histogram, please read the following site about histogram. To plot a histogram, choose Bar Chart Wizard. In Step 2 out of 4, choose Percentage for the Bar height.
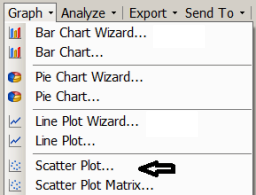
Correlation Analysis
You may plot a 2D scatter chart first for the two variables that you want to study their correlation.
If a correlation is revealed from the scatter chart, you may also calculate the exact correlation between these two variables. Assume these two variables are “Amount” and “Visits”. The following figures show how their correlation can be calculated.
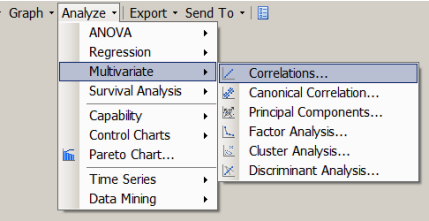
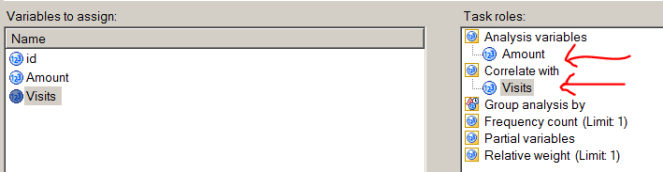
Drag Amount and Visits from the left pane to the right pane.
2021-11-22