ECMT2160: Computational Assignment
Hello, dear friend, you can consult us at any time if you have any questions, add WeChat: daixieit
ECMT2160: Computational Assignment
This assessment task requires you to use MATLAB to run some Monte Carlo simulations. You should prepare your submission as a MATLAB Live Script file (i.e., a .mlx file). Submit your answers through the Canvas course website. Your submission should include a mixture of written responses formatted as text, blocks of MATLAB code, and MATLAB output, including graphs. You should submit two versions of your answers: the original .mlx file, and a version ex-ported to .html.
You may work on this assessment individually, or in pairs. If you work in pairs, it is important that you clearly indicate the student ID number of your partner in your submission. Your submission should not be identical to your partner’s submission.
The assignment consists of two questions, each with multiple parts. Answer all parts of both questions. The assignment is worth a total of 25 points towards your final assessment. The first question is worth 15 points and the second ques-tion is worth 10 points. Points will be deducted for poor presentation, including: excessive typos, poor written expression, poor organization, etcetera.
Question 1
Before attempting Question 1, you should work through Sections 3.8 and 3.9 in the file IntroProb.mlx. Begin your submitted solution to Question 1 by running the command
in MATLAB, where STUDENTID is your 9-digit Student ID number. This fixes the sequence of random numbers to be generated in your simulation.
Suppose we roll two fair six sided dice. Let X1 denote the sum of the numbers rolled, and let X2 denote the maximum of the numbers rolled.
(a) (i) Create an 11 × 6 matrix containing the values taken by the joint prob-ability mass function of X1 and X2. The entry in row i, column j of this matrix should contain the probability P(X1 = i, X2 = j).
(ii) Create a three-dimensional bar graph displaying the joint probability mass function of X1 and X2.
(b) (i) Create a 1 × 6 vector containing the values taken by the marginal prob-ability mass function of X2. The entry in column j of this vector should contain the probability P(X2 = j).
(ii) Create a two-dimensional bar graph displaying the marginal probability mass function of X2.
(c) (i) Create an 11 × 6 matrix containing the values taken by the conditional probability mass function of X1 given X2. The entry in row i, column j of this matrix should contain the conditional probability P(X1 = i|X2 = j).
(ii) Create six two-dimensional bar graphs, each displaying the conditional probability mass function of X1 given X2 = j, with j taking the values 1 through 6 in your six graphs.
(d) In each of 10,000 iterations of a “for loop”, do the following.
(i) Generate a discrete random variable whose probability mass function is the marginal probability mass function of X2 calculated in part (b). Hint: the MATLAB command randi(6,2,1) returns a 2×1 random vector whose entries are independent random variables each equal to the numbers 1 through 6 with equal probabilities.
(ii) Calculate the conditional expectation E(X1 | X2 = j), where j is the random number generated in part (i).
Calculate the average of the conditional expectations computed over all 10,000 iterations of the “for loop”.
(e) Discuss how your findings in part (d) relate to the Law of Iterated Expecta-tions.
Question 2
Let Z be a random variable with the standard normal distribution, and let g(x) be the probability density function of the standard normal distribution. Let c(u1, u2) be the function
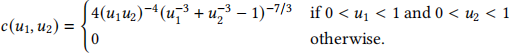
Suppose that X1 and X2 are a pair of continuous random variables whose joint probability density function is given by

for all real x1 and x2.
(a) Create a graph of the joint probability density function of X1 and X2 for values of x1 and x2 between −3 and 3.
(b) Create a graph of the marginal probability density function of X1 for values of x1 between −3 and 3. Graph it alongside the standard normal probability density function.
(c) Repeat part (b) for X2 instead of X1.
(d) Based on your answers above, do you think that the joint distribution of X1 and X2 is multivariate normal? Why or why not?
2021-11-21