STAC53 Assignment 2
Hello, dear friend, you can consult us at any time if you have any questions, add WeChat: daixieit
STAC53 Assignment 2
Question 1 (5 points)
Suppose you are planning to design a survey to estimate the average monthly household income in a city. There are 10000 households in total. From a previous census, it is known that the variance in the monthly household income is $900.
a) Using simple random sampling, what sample size should be used to estimate the population(of the city) level average within $20 of the true value with 90% confidence.
b) In Part (a), you have used equation (3) from 54 of the test book which is a result of the equation
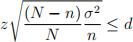
Suppose it is not possible to solve this equation for n. So you can not use equation (3) any more. In this scenario, in R,
● i) create a function for the margin of error in terms of n
● ii) create a sequence of n values (say 1 to 800)
● iii) calculate the margin of error for each of these n values using your function.
● iv) Find out in R, what is the minimum of the n value that ensures the width to be smaller or equal to 20.
Question 2 (7 points)
This question relates to the sample size calculation for estimating population proportion. Read section 5.3 on page 59 of the text book
Let’s ignore the finite population correction for this question.
Suppose you want to estimate the population proportion of households that use Rogers as their internet service provider. You want to estimate the proportion within 0.03 of the true proportion with 90% confidence.
You do not have any prior knowledge about the true proportion.
a) Use p=0.5 in equation 5.2 which is known as the conservative approach (worst-case). Calculate the required sample size.
b) Write a function in R that
i) generates “n” samples from a Bernoulli distribution with true probability 0.4 and calculates the sample proportion and variance of the sample proportion as
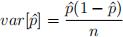
where n is the value you got in part(a). code-hint: rbinom(100,size=1,prob=0.4) generates 100 samples from Bern(0.4)
ii) calculates the 90% confidence interval using
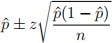
iii) calculates the width of the confidence interval and returns 1 if width Æ 0.06 or return 0 if the width > 0.06
c) By replicating your function 10000 times calculate the number of times your confidence interval had a width ≤ 0.06.
d) Repeat your calculation of part(a) but this time with p=0.4. You are supposed to get a different value of n this time.
e) Repeat the steps involved in part(b) and (c) by changing only the n value to the result of your updated calculation from part(d). How many times your confidence interval is having a width more than 0.06?
f) What conclusion can you make about the use of p=0.5 when it comes to sample size calculation for estimating proportion.
Question 3 (7 points)
This question relates to Ratio and Regression estimation
Copy these following three lines to R. Make sure you are connected to the internet while running these lines. It will load the “crabs” dataset to your working environment.

Here is a little summary of the dataset. https://rdrr.io/cran/glmbb/man/crabs.html
Treat this dataset as our population. For this question we will use “satell” as our response variable(Y) and “weight” as an auxiliary variable(X).
We are interested in the average of the variable “satell” which is the number of satellites around a female crab.
Randomly select 20 observations from the dataset(without replacement) for parts (a-c)
a) calculate the sample mean and calculate the 95% confidence interval for the population mean.
b) estimate the population mean and calculate the 95% confidence interval for the popula-tion mean using a ratio estimator.
c) estimate the population mean and calculate the 95% confidence interval for the popula-tion mean using a regression estimator.
d) Write a function in R that generates 20 samples from the population and calculates the three different estimates. By repeating your function 10000 times, calculate the MSE of each of your estimator. Comment on the best pick out of these three.
Question-4 (1 point)
● Question 1-3 are worth 19 points in total.
● I will upload a video on how to use R-markdown.
● The final 1-point of the assignment will be awarded if you use R-markdown to write your assignment (i.e. to write your answers to Ques 1-3).
2021-11-16