DATA4000 Introduction to Business Analytics
Hello, dear friend, you can consult us at any time if you have any questions, add WeChat: daixieit
Assessment 1 Information
|
Subject Code: |
DATA4000 |
|
Subject Name: |
Introduction to Business Analytics |
|
Assessment Title: |
Industry Report |
|
Assessment Type: |
Individual written assessment |
|
Assessment Limits: |
Written assessment 1000 Words (+/- 10%) + Visualisations |
|
Weighting: |
30 % |
|
Total Marks: |
30 |
|
Submission: |
via Turnitin |
|
Due Date: |
In-class assessment during Week 6 lecture |
Assessment Description
• The assessment is an in-class assessment using both analytics tools and insightful interpretation to prepare a document on 4 specific questions
• Complete Parts Ato D in class during week 6
• Consider the rubric at the end of the assignment for guidance on structure and content
• This covers LO2 and LO4
All students will need to have access to a laptop or a desktop computer in order to contribute to this task. Students will need to have downloaded and installed a BI tool of their choice.
Assessment Overview
Part A: Using Descriptive Analytics to address a business need
(300 words, 10 marks)
Imagine you are a car enthusiast interested in the performance of cars (horsepower) compared to their fuel efficiency, given rising fuel costs.
Your descriptive analytics study involves generating insight on how cars differ in their fuel consumption and horsepower based on the driveline differences in the vehicles
To complete this exercise, download exploratory.io
• Click “+” next to data frames to upload cars data
• Generate a cluster analysis using the variables of miles per gallon in the city, miles per gallon on the highway and horsepower of the vehicle, categorised by its driveline (front wheel drive, rear wheel drive, 4 wheel drive, all wheel drive)
• Run and document all reports produced by the analysis, noting the number of data points in each cluster and the number of data points in the total sample
• Describe the information shown in each chart or table
• Explore the clusters generated using the various charts and provide insights into the results, paying particular attention to how well the cluster analysis has distributed the population in the clusters
• Describe the clusters and your level of confidence in using the clusters to describe the driveline characteristics of the cars.
Part B: Using Predictive Analytics to assist with a business problem
(200 words, 5 marks)
Imagine you are an investor who has a special interest in trading shares in oil and gas companies.
In so doing, you regularly monitor the prices of stocks in this sector. To assist with your future trading activity, you are presently monitoring the historical performance of major oil and gas companies.
However, the information presented covers data that could be considered stale. Therefore, only data from 2003 and after should be used.
You have been asked to produce and document graphs that will allow you to fit trend lines, using a BI tool (Power BI, Tableau) to the oil and gas stock prices provided in the data set.
Following the production of the graph and the subsequent trend lines, you have been asked to provide an insight into which stocks have performed better over time , describing how you came to that conclusion.
Next you need to provide a recommendation on when to buy the various shares.
• When is the best month to sell shares for maximising the sales price of your stock?
• When is the best month to buy shares for minimising the price of the stock?
Your analysis may include all oil and gas stocks provided or a select few, with justification as to why you selected only these stocks.
Provide a reflection on whether you can rely on historical trends alone in making your investment decisions. What type of market conditions might influence your decision and are there any external factors or considerations that might influence your future judgement?
Part C: Example of Prescriptive Analytics in addressing a business problem (300 words, 5 marks)
Describe how prescriptive analytics can be used as part of a solution to a business problem with reference to ONE real-world business and case study of your own choosing.
You will need to conduct independent research and consult resources provided in the subject. Describe how the chosen business specifically uses prescriptive analytics and provide references.
NOTE: do not use ChatGPT for this section unless you can reference it and show your prompts. You must also verify that you did some research of your own in this section.
Part D: Storytelling
(200 words, 10 marks)
Imagine you are a consultant tasked with an analytics exercise to report to a European Union inquiry about the status of resourcing in libraries in 4 European countries, namely:
• Italy
• Estonia
• France
• Denmark
Use the libraries data set in Tableau or Power BI to build a story as to why library usage may differ in the 4 countries.
Develop some metrics (eg. calculated fields) and illustrate these metrics either on geographic maps or within your insights commentary.
Present your story as a narrative as to what future best practice of resourcing of libraries by countries might be, supported by your visualisations. This may include other factors and assumptions that you may have used and external data you may have either included in your analysis or wish to include. State your assumptions and any additional data you may wish to incorporate into the analysis.
Important Study Information
Academic Integrity and Conduct Policy
https://www.kbs.edu.au/admissions/forms-and-policies
KBS values academic integrity. All students must understand the meaning and consequences of cheating, plagiarism and other academic offences under the Academic Integrity and Conduct Policy.
Please read the policy to learn the answers to these questions:
• What is academic integrity and misconduct?
• What are the penalties for academic misconduct?
• How can I appeal my grade?
Late submission of assignments (within the Assessment Policy)
https://www.kbs.edu.au/admissions/forms-and-policies
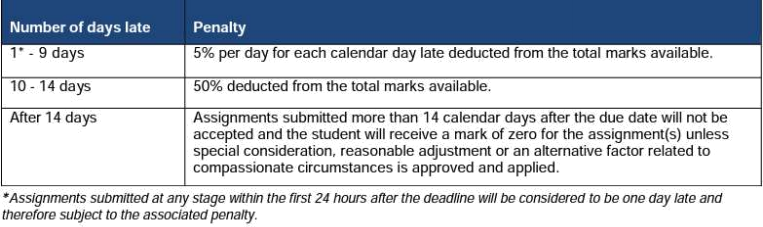
In-class assessments are subject to the following penalties:
• All submissions for in-class assessments conducted during a class are to be handed in by the deadline set in class.
• If the submissions are not handed in by the in-class deadline set, a mark of 0 (zero) will be given.
• Not attending the in-class assessment will result in a mark or 0 (zero)
Length Limits for Assessments
Penalties may be applied for assessment submissions that exceed prescribed limits.
Study Assistance
Students may seek study assistance from their local Academic Learning Advisor or refer to the resources on the MyKBS Academic Success Centrepage. Further details can be accessed at
https://elearning.kbs.edu.au/course/view.php?id=1481
2024-04-19