CS-677: Data Science With Python
Hello, dear friend, you can consult us at any time if you have any questions, add WeChat: daixieit
CS-677: Data Science With Python
Assignment
In this assignment, you will use Python to analyze the dis-tribution of returns and a number of trading strategies. This assignment has to be done in Python only (no NumPy or Pan-das) except for generating daily returns data and saving it to a file.
As part of the preliminary assignment, you have generated a daily stock file for your stock and a daily file ”spy.csv” for the S&P-500 (using the symbol ”spy”). For both files, you have data for 2015 - 2019 (5 years).
In this assignment, you will investigate 2 sets of questions con-cerning daily returns
1. If you buy a stock for just one day, what is the best day of the week to do so. Specifically you will analyze the daily returns for each day of the week. A ”Monday” return is the percent change in (adjusted) closing price from previ-ous Friday to Monday. A ”Tuesday” return is the percent change in price from Monday to Tuesday and so on.
2. comparison of returns if you have an ”oracle” that can pre-dict the future behavior of your stock price
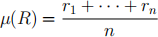
We start with introducing some notation. Let R = {r1, . . . , rn} denote your daily returns for your stock for n days. The mean of the daily returns
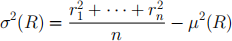
To compute the standard deviation σ(R) we can use
Let us split the daily returns R into two sets
1. R−: all negative returns
2. R+: all non-negative returns
Finally, let |R−| denote the number of days with negative re-turns, and |R+| denote the number of days with non-negative returns.
Question 1:
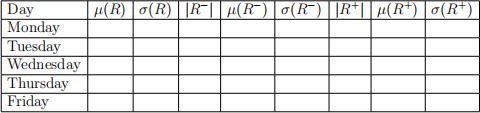
1. for each of the 5 years, compute the mean and standard deviation for the sets R, R− and R+ of daily returns for your stock for each day of the week
2. summarize your results in the table as shown below (5 tables total).
3. are there more days with negative or non-negative returns?
4. does your stock lose more on a ”down” day than it gains on an ”up” days.
5. are these results the same across days of the week?
Question 2: Examine your 5 tables.
1. are there any patterns across days of the week?
2. are there any patterns across different years for the same day of the week?
3. what are the best and worst days of the week to be invested for each year.
4. do these days change from year to year for your stock?
Question 3: Compute the aggregate table across all 5 years, one table for both your stock and one table for S&P-500 (using data for ”spy”).
1. what is the best and worst days of the week for each?
2. are these days the same for your stock as they are for S&P-500?
For the next questions, suppose that you have an ”oracle”. On any day, this oracle could tell you whether price of any stock would increase or decrease the next day. Assume that you have no transaction costs. You start with $100 on the first trading day of 2015 to trade your stock and another $100 to trade ”spy”.
Question 4: You listen to the oracle and follow its advice. How much much money will you have on the last trading day of 2019:
1. your stock?
2. S&P-500 stock?
Question 5: Consider ”buy-and-hold” strategy: you buy on the first trading day and sell on the last day. So you do not listen to your oracle at all. As before, assume that you start with $100 for both your stock and ”spy”.
1. how much money will you have on the last trading day of 2019?
2. how do these results compare with results obtained in ques-tion 4?
Question 6: Your oracle got very upset that you did not follow its advice. It decided to take revenge by giving you wrong advice from time to time. Specifically, let us consider the following three scenarios:
(a) Oracle gave you wrong results for the best 10 trading days. In other words, you missed the best 10 days and your overall profit will be lower.
(b) Oracle gave you wrong results for worst 10 trading days. In other words, you missed the worst 10 days and your overall profit will be higher.
(c) Oracle gave you wrong results for best 5 days and for the worst 5 days.
Please answer the following:
1. for each of the scenarios above (a,b and c), compute the final amount that you will have for both your stock and ”spy”
2. do you gain more by missing the worst days or by missing the best days?
3. are the results in part (c) different from results that you obtained in question 4.
2021-11-13