Predicting Heart Disease: Foundations of Machine Learning
Hello, dear friend, you can consult us at any time if you have any questions, add WeChat: daixieit
Predicting Heart Disease:
Foundations of Machine Learning
Introduction
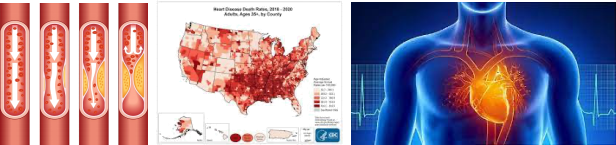
Heart disease in both men and women is a leading cause of death in the United States, accounting for approximately 20% of all deaths. Heart disease is characterized by the build-up of plaques in the arteries feeding blood to the heart. Risk factors for heart disease include smoking, lack of exercise, excessive alcohol consumption, and an unhealthy diet. Increasingly, Artificial Intelligence is being incorporated into Electronic Medical Record systems to help doctors identify patients at risk of heart disease. In this assignment you will build a machine learning classifier that predicts whether a patient has heart.
Expectations
We expect you to write your code in a modular style using a well-defined collection of functions. The functions you implement are totally at your discretion. You will be graded on a) correctness, b) code design and efficiency, and c) documentation and style.
Requirements
1. Read the heart disease data (heart.csv) into a dictionary where the key is the column name and the
value is that column’s list of values. Do not read your data into any other type of data structure. Convert numeric values to integers or floating-point values as appropriate. We suggest using list comprehensions to carry out the type conversions. Your final data structure will look something like this:
data = { “Age”: [40, 49, 37, . . . ],
“Sex”: [M, F, M, . . . ],
.
.
“HeartDisease”: [0, 1, 0, 1, . . .] }
2. Our heart disease dataset consists of N=918 patients. Each patient has six attributes (Age, Sex, Type of Chest Pain, Resting Blood Pressure (BP), Cholesterol level, Maximum Heart Rate (HR). The last column indicates whether the patient has heart disease (No=0, Yes=1) and it is this value that we are trying to predict.
3. For each patient in the data set, find the patient that is most similar. This most-similar patient is called the nearest neighbor. The heart disease status of the nearest neighbor is our prediction. We are pretending that we don’t know our patient’s true heart disease status and instead we are relying on the most similar nearest neighbor patient to make a prediction. This enables us to test the overall accuracy of our algorithm. If the true heart disease status of the test patient is the same as the heart disease status of the most similar patient (nearest neighbor), then your prediction for that test patient is correct! Now repeat the process of predicting each patient’s heart disease status. To find the nearest neighbor we use the following distance formula:
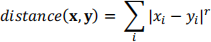
where xi and yi are the values for the ith numeric attribute of x and y respectively and r is a tuning parameter used to configure the distance function. If r = 2, our distance measure is called the Euclidean distance, while a value of r = 1 represents the Manhattan distance. The summation symbol tells us to sum up each attribute’s absolute-value difference across all numeric attributes. The abs function may come in handy here. Non-numeric attributes such as sex, and the type of chest pain may be ignored. Instead, you will measure distance between two patients using only the four numeric attributes: Age, RestingBP, Cholesterol, and MaxHR. Remember that the HeartDisease status (last column) is what we are trying to predict and so should not be included in our distance calculation.
4. Report the accuracy of your machine learning classifier. Using both r = 1, and r = 2, report three
measures of accuracy. To understand our accuracy measures, first we must understand the following definitions:
True Positive: Correctly predicting that a sick patient has heart disease.
True Negative: Correctly predicting that a healthy patient does not have heart disease.
False Positive: Incorrect predicting that a healthy patient has heart disease.
False Negative: Incorrectly predicting that a sick patient does not have heart disease.
a. Precision: What fraction of patients that you predicted to have heart disease actually do have heart disease? A high precision means that we are avoiding false positives. Formally,
Precision = True Positives / (True positives + False Positives)
b. Recall: What fraction of patients that truly have heart disease were predicted to have heart
disease? A high recall means that our classifier is doing a good job of detecting sick patients. Recall is also called Sensitivity. Recall = True Positives / (True Positives + False Negatives).
c. Overall Accuracy: What fraction of our patients were classified correctly? Overall accuracy can be quite misleading particularly in datasets where one class is over-represented compared to another class. In this data set, about 55% of the patients are sick with heart disease so if we simply predicted that every patient is sick, we would achieve a baseline accuracy of 55%. Can we do better?
5. Generate a scatter plot of Maximum Heart Rate (y axis) vs. Age (x axis). Color code the markers so
that sick patients with heart disease are red, and healthy patients with no heart disease are blue.
Include a legend. To create legends, include a label parameter in the call to scatter, and call scatter
once for the healthy patients, and once for the sick patients. Then use the command plt.legend() to generate the legend.
What to Submit
Submit your program (heart.py), your visualization (heart.png), and your classification accuracy report (heart.txt). When submitting (or resubmitting), it is your responsibility to verify that ALL required files have been received by GradeScope. If you forget to submit your code, your visualization, or your output, or you submit the wrong files, your grade will likely be affected.
2024-04-13